
 Home
Home News
News
- 1 ZEC coin pulled back from its recent low of $30.
- 2 Bulls are straining to accumulate further but facing rejection from 100-day EMA.
ZEC coin price action was correctional in the last few months and slid below every support mark. The bearish cycle in the coin still favors sellers and tries to break the transient momentum showcased by bulls. ZEC coin enlisted a bounce from its support mark of $30 but is now facing rejection near the channel upper neckline and 100-day EMA. Moreover, the price action does not favor bulls because of the weaker momentum. However, buyers are trying to smash above $40, an immediate hurdle. Last month, when ZEC coin was in the consolidation phase, it broke the lower neckline and showed a decent fall. Afterward, weakness in the coin persisted as it tested multiple support levels.
At the time of writing, ZEC is trading at $36.765, dropping 1.63% in the intraday session. However, the pair of ZEC/BTC is at 0.001326 satoshis. The trading volume increased by 8%, favoring sellers. However, ZEC gradually moved to the $40 mark without breaking it. This rejection weakened the momentum of the bulls and the sellers, aggressively pushing the price below the 20-day EMA.
ZEC Daily Chart Shows a Pullback
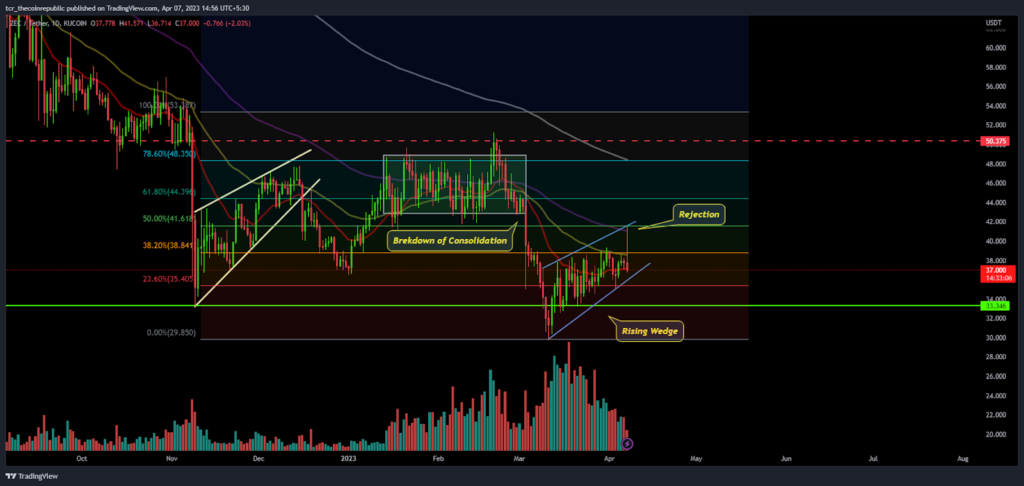
On the daily chart, ZEC looked weaker as it returned to the lower Bollinger band to retest the support level. Moreover, it broke below 20-day EMA, provoking sellers further.
ZEC coin forms a rising wedge pattern, and the price rejects from the upper zone and heads forward to test the lower bottom. If the price breaks below $35, ZEC will steer towards testing $30 again. The price action indicates that the bulls try to hold neutrality but cannot hold it there. Moreover, the Fib extension indicates that the price rejects from the 50% level, a sign of reversal. If the price attains above the 50% range, buyers will get momentum, below that, the selling pressure resumes.
ZEC Short Term chart Shows Bearish Cues
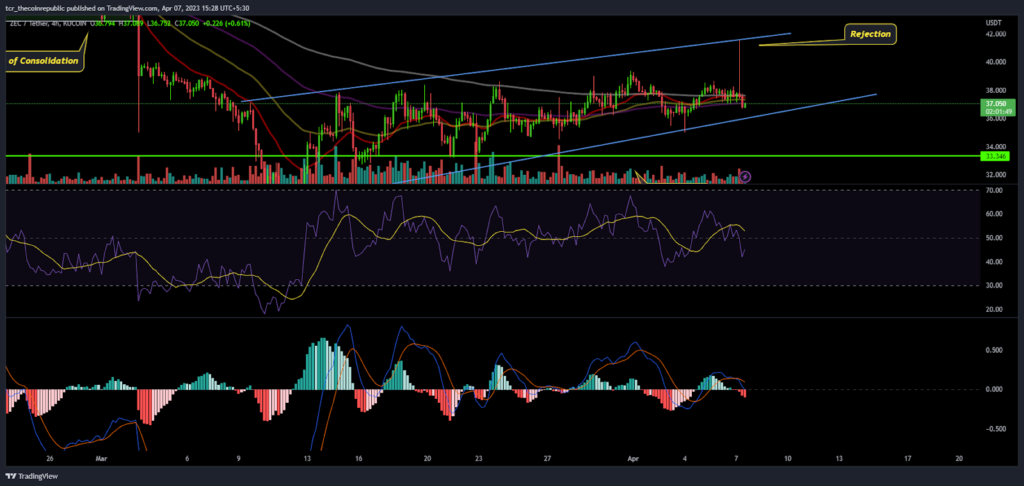
ZEC on the 4-hour chart shows that the bears are still active and are attempting to break the bullish momentum generated in the last few sessions. The rejection faced by bulls indicated that the bears maintained a grip near $40 and did not allow the price to rise from there. Moreover, the RSI slipped below neutrality, indicating a bearish cycle. The MACD indicator noted a bearish crossover in the last session, indicating a fresh reversal or downtrend.
Technical Levels
Support Levels:$35 and $30
Resistance Levels:$40 and $45
Conclusion:
ZEC price shows that after a pullback, the price is heading towards completing the retracement phase, which will decide the following trend.
Disclaimer
The views and opinions stated by the author, or any people named in this article, are for informational purposes only, and they do not establish financial, investment, or other advice. Investing in or trading crypto assets comes with a risk of financial loss.

Andrew is a blockchain developer who developed his interest in cryptocurrencies while pursuing his post-graduation major in blockchain development. He is a keen observer of details and shares his passion for writing, along with coding. His backend knowledge about blockchain helps him give a unique perspective to his writing skills, and a reliable craft at explaining the concepts such as blockchain programming, languages and token minting. He also frequently shares technical details and performance indicators of ICOs and IDOs.


