
 Home
Home News
News
- FTM price is currently trading at $0.4501 with a decrease of -3.53%.
- The 24 hour high of the price is $0.451 and the 24 hour low is $0.4959.
- The 24 hour trading volume has increased by 31.60%.
FTM price has been in a bullish trend since the start of 2023, which took the price from $0.1700 level to $0.6500. The FTM price was in a downward channel after making highs of $0.6500 on a daily basis making lower lows and lower highs which took prices from the $0.6500 to $0.3350 level.
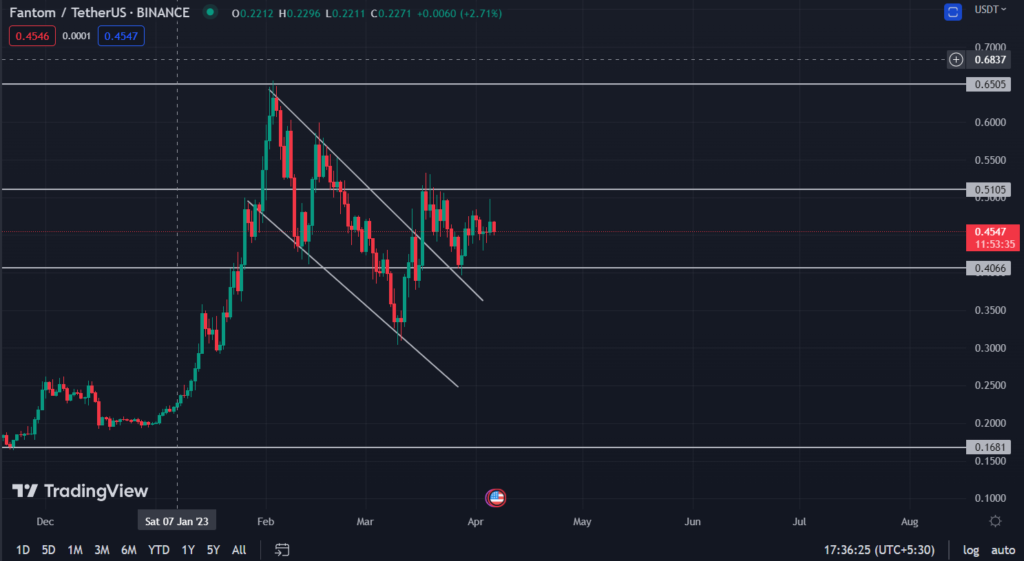
FTM has rebounded 36% since making a low of $0.33 on March 11. The on-chain data shows that the FTM is attracting new demand, indicating that the FTM has a chance to break above the $0.510 level.
The price has been consolidating between the range of $0.400 to $0.5100 since mid-March due to the bullish momentum the FTM price broke above the downward trend. The global in/out money data presented by Intotheblocks states that price might hit a sell wall at $0.47 level as this is the maximum price that 3800 addresses have paid for their 1 billion fantom coins. If the price breaks above $0.47 level, we could easily target $0.60 where the other 4670 addresses have bought 75 million Fantom coins. However, if the price slips below $0.40 level, the next target for the price is the low of $0.33l.
Technical Analysis of FTM
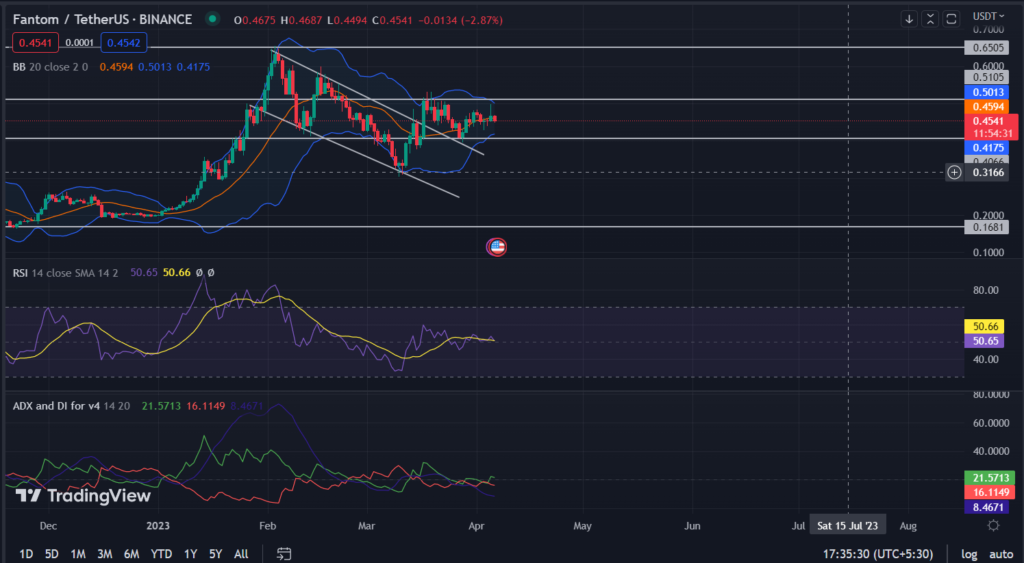
The RSI curve crossed the half mark as price gained bullish momentum after reaching $0.400 level. The RSI curve is currently at 50.81 with the same level as the median line.
The previous candle pattern rejected the $0.50 level, which indicates the move downward to $0.40 level. The RSI curve on the 4 hour basis has turned downwards and has crossed the median line negatively, showing rise of seller pressure in the market as price recently faced rejection from $0.50 level resistance.
The +DI is currently above the -DI on a daily basis indicating that there is still bullish momentum left in the price, but the ADX Is at 8.46 which is low strength. The only way for the price to gain bullish or bearish momentum is to break through the consolidation zone.
The bollinger band has squeezed, indicating low volatility in the market as price enters in a consolidation. The price is currently trading near the 20 days SMA of bollinger band indicating indecisiveness in the price.
Conclusion
The FTM began its bullish run from the start of 2023. It might be having some setbacks but the overall trend for FTM is currently bullish. If we can see a break above the $0.50 level, this would provide us confirmation for bullish sentiment in the market while if we break below $0.40 level, there is an easy move for the price to reach $0.33 level.
Technical levels:
Major support: $0.40
Major resistance: $0.50
Disclaimer:
The views and opinions stated by the author, or any people named in this article, are for informational purposes only and do not establish financial, investment, or other advice. Investing in or trading crypto assets comes with a risk of financial loss.

Nancy J. Allen is a crypto enthusiast, with a major in macroeconomics and minor in business statistics. She believes that cryptocurrencies inspire people to be their own banks, and step aside from traditional monetary exchange systems. She is also intrigued by blockchain technology and its functioning. She frequently researches, and posts content on the top altcoins, their theoretical working principles and technical price predictions.


