
 Home
Home News
News
- Uniswap price is currently trading at $6.034 with a decrease of -0.71%.
- Uniswap is in an upward channel making higher highs and higher lows.
- The 24 hour trading volume has increased by +15.54%.
The uniswap price started its bullish run during the start of 2023 and made a high at $7.61 level which was not sustainable for the price and came straight down to the $5.50 level. The price is currently consolidating between the range of $5.40 and $6.50. The price on the 4 hour basis is making higher highs and higher lows.
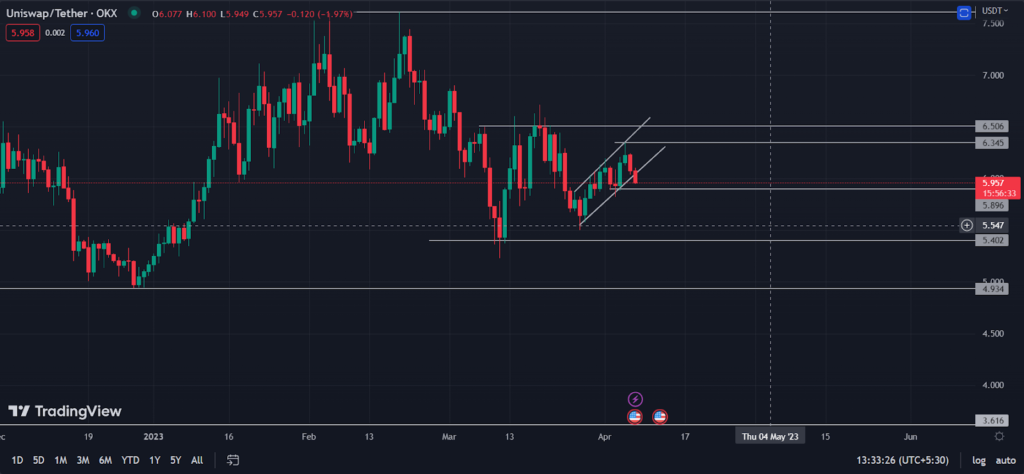
Looking at the overall trend, the price is in bearish trend and the high of $6.50 made can be seen as a pullback to drive the price further down. The bullish channel formed on the 4 hour basis has the potential to take price to $6.50 for retesting and overall breaking the resistance to again touch the highs of $7.61. The first target for the price is breaking the immediate resistance of $6.50 which would indicate a shift in market sentiment.
The price on the 4 hour basis has broken the trendline and is headed towards the $5.90.
As per the into blocks, the current volatility of the price is near to 74.67% which is close to 30 day high volatility which was 78.28% as price turns bearish. The bitcoin has turned bearish and the correlation between uniswap and bitcoin for the past 30 days is 0.33 which has also affected uniswap prices.
Technical analysis of uniswap:
The RSI curve has dipped heavily after price broke below the trendline. The RSI curve on a 4 hour basis is at 39.63 as price gains bearish momentum crossing the median line negatively while on the daily basis, the RSI curve is still near the median line and has crossed the half mark negatively. The RSI curve is currently at 47.35 on a daily basis.
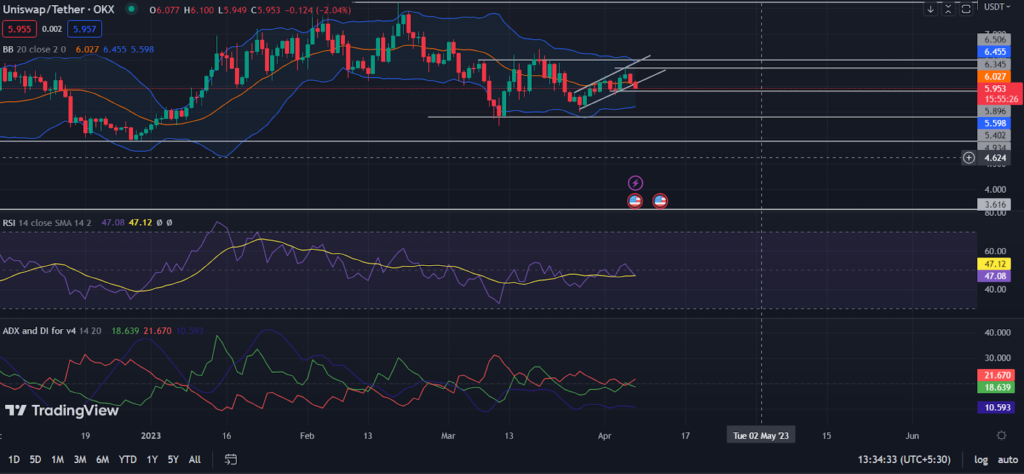
The -Di has crossed the +DI on the daily basis with ADX of 10.59 which is low as the price has just broken the upward channel. On a 4 hour basis, the -DI is above the +DI with ADX of 19.65 which is gradually increasing as the market sentiment shifts bearish.
The price crossed the 20 day SMA of bollinger band indicating bearish pressure and lower band is near to the support of $5.40. On a 4 hour basis, the price will soon reach the lower band which is near the support of $5.90 and we might expect a pullback from the price.
Conclusion:
The price has broken the upward channel indicating strong bearish pressure on the price. We can expect a decline in the upcoming days. If the price is able to break the $5.90 level, there is an easy move for the price to reach the $5.60 level. The market structure and price action as of now are bearish and investors should wait for confirmation before entering a buy position.
Technical levels:
Major support: $5.90 and $5.60
Major resistance: $6.35 and $6.50
Disclaimer:
The views and opinions stated by the author, or any people named in this article, are for informational purposes only and do not establish financial, investment, or other advice. Investing in or trading crypto assets comes with a risk of financial loss.

Andrew is a blockchain developer who developed his interest in cryptocurrencies while pursuing his post-graduation major in blockchain development. He is a keen observer of details and shares his passion for writing, along with coding. His backend knowledge about blockchain helps him give a unique perspective to his writing skills, and a reliable craft at explaining the concepts such as blockchain programming, languages and token minting. He also frequently shares technical details and performance indicators of ICOs and IDOs.


