
 Home
Home News
News
- RPL price is trading above the Daily Moving Average of 50 Days and is lagging behind 20 days of the Exponential Moving Average.
- The current price of the Rocket Pool is $43.35 and has dropped 8.74% in the last intraday trading session.
- The pair of RPL/BTC is 0.001441 BTC and increased by 8.54% in the last 24 hours.
Rocket Pool’s price is fluctuating over the daily price chart. The ups and downs created by the bulls and bears respectively are making it difficult for RPL to get stable. The sellers and buyers both are trying to dominate the RPL’s market. Although the buyers are driving the price of the RPL since its launch. The RPL has got some dips in between and now the sellers again try to give a dip to the RPL.
The RPL token is currently trading at $43.35 with a drop of 8.74% during the last intraday trading session. The buyers might lose their grip on the RPL crypto. The upward trend may continue, making it challenging for the sellers to get involved in the trade. The price might increase due to bullish accumulation to both the primary resistance of $47.39 and the secondary resistance of $53.88.

The price may hit the primary support of $37.91 or even further to the secondary support of $34.72. Bulls may be ready for any disruptions by bears since RPL’s upward trend might get a reversal. The seller’s attempt to get into trade might get successful and the movement of RPL might get reversed.

The volume of RPL token increased by 169.63% in the last 24 hours. The drastic increase in volume indicates that buying is getting stronger and the buyers are too active and are getting involved in the trade. The short-selling pressure over the RPL is decreasing. The volume-to-market cap ratio is 0.0283.
Technical Analysis of Rocket Pool
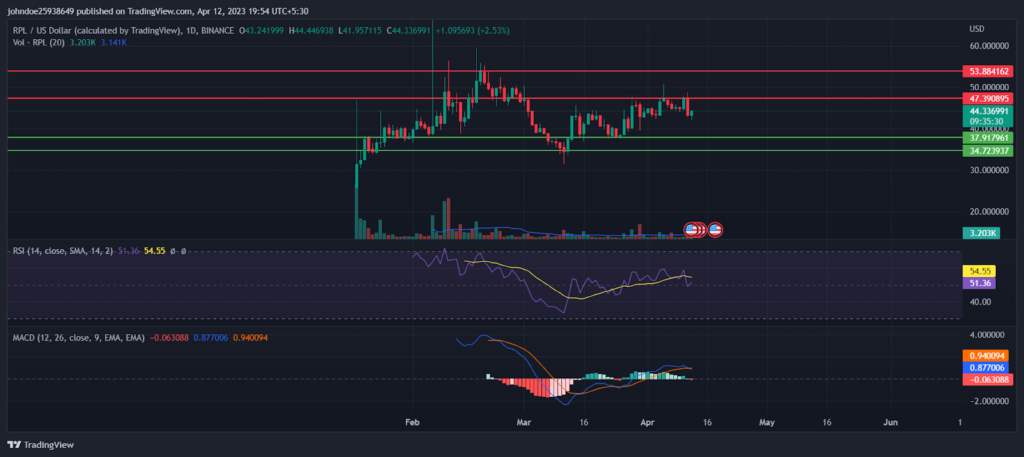
The technical indicators show that: The RSI is neutral, the current RSI is 50.70 and the average RSI is 54.50. The MACD and MACD signal have intersected producing a negative crossover. RPL price is trading above the Daily Moving Average of 50 Days and is lagging behind 20 days of the Exponential Moving Average. The buyers might lose a grip over the RPL and sellers might dominate the market.
Conclusion
The Rocket Pool’s price is currently fluctuating over the daily price chart. The buyers are currently driving the price of RPL, and the upward trend may continue, making it challenging for the sellers to get involved in the trade. However, the RSI is neutral, and the MACD has produced a negative crossover, indicating that the buyers might lose their grip over RPL, and sellers might dominate the market.
Technical Levels
Support Levels: $37.91 and $34.72
Resistance Levels: $47.39 and $53.88
Disclaimer
The views and opinions stated by the author, or any people named in this article, are for informational ideas only. They do not establish financial, investment, or other advice. Investing in or trading crypto assets comes with a risk of financial loss.

Nancy J. Allen is a crypto enthusiast, with a major in macroeconomics and minor in business statistics. She believes that cryptocurrencies inspire people to be their own banks, and step aside from traditional monetary exchange systems. She is also intrigued by blockchain technology and its functioning. She frequently researches, and posts content on the top altcoins, their theoretical working principles and technical price predictions.


