
 Home
Home News
News

- 1 The THETA price is currently trading at $1.027 while seeing a change of -11% in 24-hour trading volume.
- 2 The THETA price has been observing a decline of 4.34% in the last 24 hours.
- 3 The price of THETA can make a bearish correction in the near future.
The THETA price broke its correction pattern in its recent downtrend. At present, the THETA price is trading below the 200 EMA. Investors’ sentiments are currently influenced by bears as the price is making consolidation under major key EMA’s.

Analysts had earlier predicted the price could make a short correction as it was trading at the supply zone of descending flag pattern. As such, the price made a correction of 10%.

THETA price made a bullish candle and made a breakout through the descending flag channel, after which it is moving within a rectangular consolidation channel.
BCT price trading under the supply zone on the (Daily Timeframe)
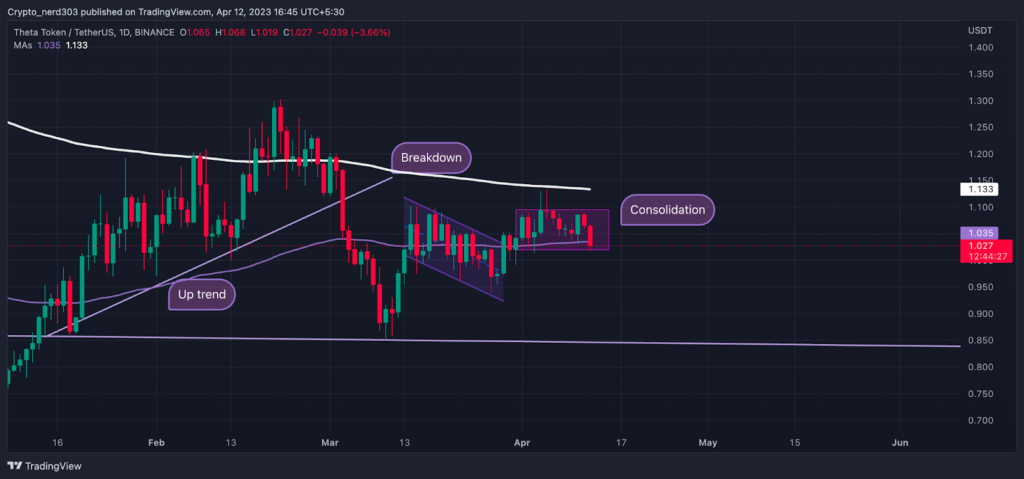
The price has been moving on a bull trend since early January after which THETA made its last higher high near $1.300. It made an attempt to cross above the 200 EMA but faced critical resistance. As such, the price made a downturn of 13%. Following this, the price crossed below its support line with a strong bearish engulfing candle.
After the breakdown, Theta Network’s price lost 21% of its overall value, making its new lower low. However, after making a hammer pattern near its base support line of around $0.850, Theta Network gained buyers’ support and made a bullish rally of 30%.
Technical Analysis ( 1 Day Timeframe )
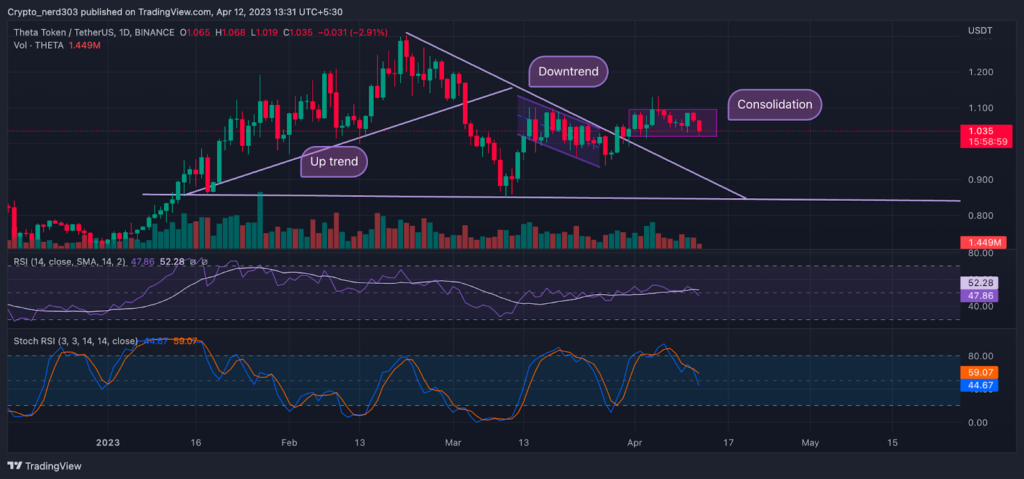
The RSI is currently below the median line where it crossed below the 14 SMA. The RSI line is moving around the price of 47.86, while the 14 SMA is around point 52.28 on the daily timeframe. The RSI line might give a bearish crossover in the near future.
The Stochastic RSI has recently taken a reversal from the overbought levels and is crossing below the median line. The current value of Stochastic RSI is 44.57 points.
Conclusion
THETA price is giving bearish indications. Technical indicators are also supporting this assessment. The RSI line is crossing below the median line; intercepting the 14 SMA. Stochastic has already taken a reversal from oversold levels. The price is facing rejection from the 200 EMA while it is making a double top pattern. There is an increase in the red volume of candles.
Technical levels –
Support -$0.950
Resistance – $1.150
Disclaimer
The views and opinions stated by the author, or any people named in this article, are for informational purposes only, and they do not establish financial, investment, or other advice. Investing in or trading crypto assets comes with a risk of financial loss.

With a background in journalism, Ritika Sharma has worked with many reputed media firms focusing on general news such as politics and crime. She joined The Coin Republic as a reporter for crypto, and found a great passion for cryptocurrency, Web3, NFTs and other digital assets. She spends a lot of time researching and delving deeper into these concepts around the clock, and is a strong advocate for women in STEM.


