
 Home
Home News
News

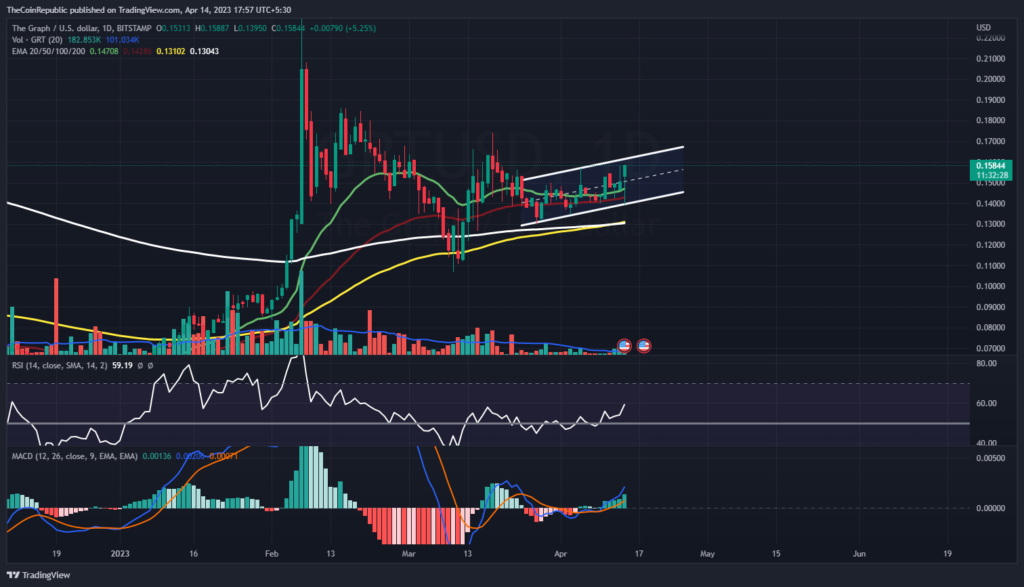
- 1 The Graph price prediction suggests the recovery of GRT crypto inside the ascending parallel channel over the daily time frame chart.
- 2 GRT crypto has surged above 20, 50, 100 and 200-days Daily Moving Average.
- 3 The pair of GRT/BTC was at 0.000005139 BTC with an intraday gain of 4.34%.
The graph price prediction indicates a strong uptrend momentum for the token towards the breakout from the ascending parallel channel. In the meantime, buyers are attempting to give the GRT token the push it needs to break out from the rising parallel channel’s upper trendline on the daily time frame chart. Sellers are still active in the trade, attempting to bring GRT cryptocurrency back into the pattern.

In order to hold at the neckline of the ascending parallel channel pattern, the graph price must maintain the current accumulation rate. Additionally, the GRT cryptocurrency price is attempting to keep itself above the 20, 50, 100, and 200-days Daily Moving Average in order to signal the breakout of the token.

The Graph price was $0.158 and during the day’s trading session, it increased 5.02% in market value. The 34% increase in trading volume demonstrates the bulls’ rate of accumulation throughout the intraday trading session. Market capitalization to volume was 0.04716.
The Graph Price Surged 186% Year To Date
The daily time frame chart ascending parallel channel shows the GRT token’s recovery phase, according to the graph’s price projection. In the meantime, GRT cryptocurrency has to keep up the present rate of bullish accumulation in order to hold at the neckline. The accumulation rate is evident from the trading volume, which is above average.
The price of the graph has increased by roughly 10.44% over the past week and by 104.70% over the past three months. In the last six months, GRT crypto has recovered about 86%. Additionally, the greatest recovery of the GRT cryptocurrency is predicted to occur in 2023 based on The Graph’s year-to-date rise of 186.30%.
Technical indications point to the price of The Graph moving upward. The relative strength index displays the GRT token’s upward momentum. The RSI was at 59 and is currently moving straight into overbought territory.
The Graph Crypto’s strong upward trend is clearly visible in MACD. After a positive crossing, the MACD line is higher than the signal line. GRT cryptocurrency investors must wait till the price of GRT sustains at the upper trendline and reaches its maximum recovery.
Summary
The graph price prediction indicates a strong uptrend momentum for the token towards the breakout from the ascending parallel channel. The daily time frame chart ascending parallel channel shows the GRT token’s recovery phase, according to the graph’s price projection. The price of the graph has increased by roughly 10.44% over the past week and by 104.70% over the past three months. The Graph Crypto’s strong upward trend is clearly visible in MACD.
Technical Levels
Resistance Level: $0.1595 and $0.1660
Support Level: $0.14 and $0.1311
Disclaimer-
The views and opinions stated by the author, or any people named in this article, are for informational purposes only, and they do not establish financial, investment, or other advice. Investing in or trading crypto assets comes with a risk of financial loss.
Steve Anderson is an Australian crypto enthusiast. He is a specialist in management and trading for over 5 years. Steve has worked as a crypto trader, he loves learning about decentralisation, understanding the true potential of the blockchain.


