
 Home
Home News
News
- 1 The YFI price is currently trading at $9089 while seeing a change of 22% in 24-hour trading volume.
- 2 The YFI price has been observing a decline of 1.40% in the last 24 hours.
Yearn Finance provides an aggregator service for decentralized finance. YFI platform uses an automation process with the help of which investors can take maximum benefit and profit from yield farming. This is a process where users lock up their cryptocurrency in decentralized finance (Defi) protocol so that they can generate interest.
The YFI price is currently trading under a consolidation channel on the daily timeframe. The price of YFI recently made a bullish breakout through the 200 MA and EMA. This is a major bullish indication because the majority of the time some buyers prefer EMA and other SMA. Hence the price often creates a contrasting situation where despite breaking out from one moving average the price takes rejection from another.
Yearn Finance price trading near supply zone
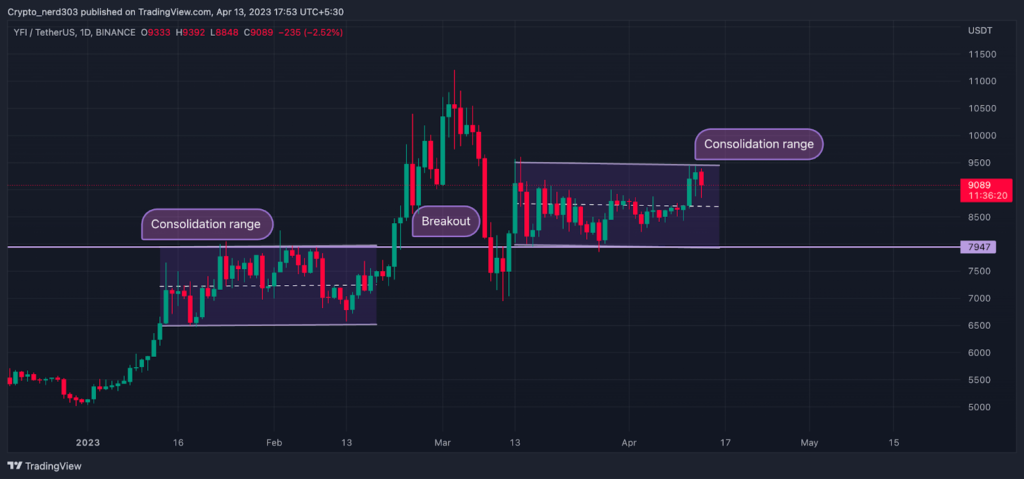
However, because the price moves above both 200 MA and EMA which is the major resistance level while consolidating, it significantly increases the chances of the YFI price making a bullish breakout and starting on an uptrend. Although before making a breakout the Yearn Finance price can take a bearish correction.
The Yearn price after making a bullish move of 48 percent near mid-January started moving under a consolidation below 200 EMA. The price made a breakout through the consolidation channel near mid-February where it also crossed above the 200 EMA making a golden crossover. After taking a retest from 200 EMA the price is again consolidating above 200 EMA.
Technical Analysis
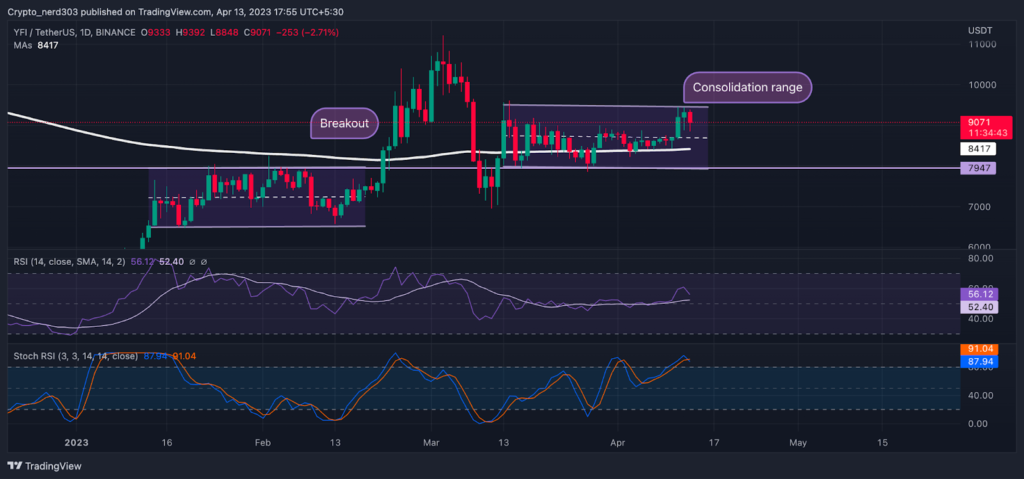
The RSI line is taking a reversal near the level of 60 points. Currently, the RSI line is trading near 56.12 points while trading above the 14 SMA which is trading at 52.40 points. The RSI curve is suggesting that it will soon start moving toward the oversold levels while the 14 SMA near the median line might provide support to it.
The Stochastic RSI line is trading near the overbought levels of around 91 points. The blue and red lines of the stochastic line are making a bearish interception. This suggests that the price can make a bearish reversal from the current level.
Conclusion
The YFI price is currently trading above the 200 EMA under a consolidation as the price is trading above both the 200 EMA. the chances of a bullish breakout being made are more significant. Although the price is trading near the supply zone of the consolidation a bearish correction is due for the YFI price. The ocilators are supporting the chances of a bearish mometum in the near future.
Technical levels –
Support -$7947
Resistance – $9500
Disclaimer
The views and opinions stated by the author, or any people named in this article, are for informational purposes only, and they do not establish financial, investment, or other advice. Investing in or trading crypto assets comes with a risk of financial loss.

With a background in journalism, Ritika Sharma has worked with many reputed media firms focusing on general news such as politics and crime. She joined The Coin Republic as a reporter for crypto, and found a great passion for cryptocurrency, Web3, NFTs and other digital assets. She spends a lot of time researching and delving deeper into these concepts around the clock, and is a strong advocate for women in STEM.


