
 Home
Home News
News
- 1 The BSV price is currently trading at $38.87 while observing a change of 9% in the 24-hour trading volume.
- 2 The BSV price is observing a decline of 1.91% in the last 24 hours.
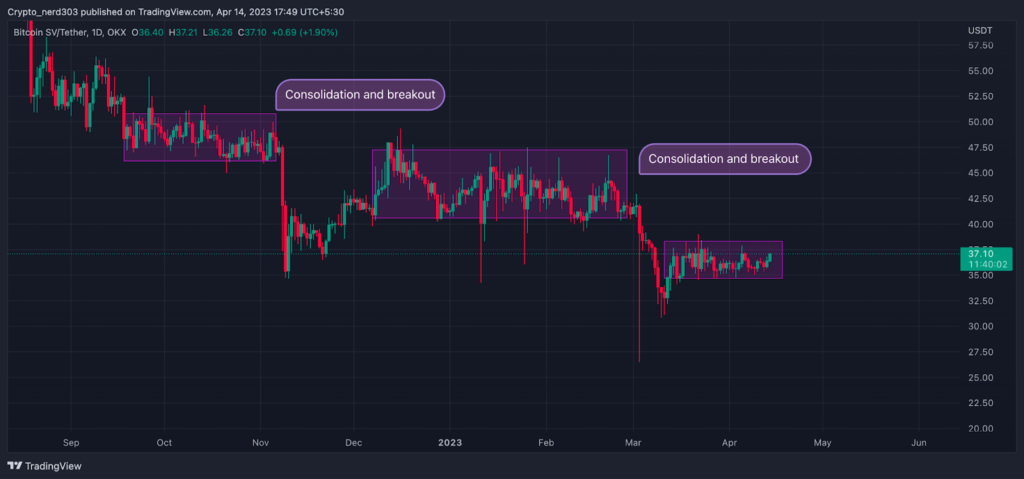
BSV price has been trading under a severe downturn since the last 12 months. The price is currently consolidating just below all the major key EMA’s -20,-50,-100,-200. Price is making a consolidation and breakout pattern. The price action suggests that Bitcoin SV price may continue its bear trend.
In early March, the price made a major mock selloff movement. It made an extremely bearish candle where the wick of the candle itself was 32% long. The whole movement was made within an hour. These moves are often made by the whale investors in the market. After this, the price continued moving on the bearish trend with a 20% downturn. The price has been showing volatile movement for the past few weeks.
The BSV price is trading within a consolidation range
There has been a bullish movement in the overall market. The market sentiments are currently near the greed zone of around 68 points, as per the greed and fear index provided by the Alternative(dot)me platform. It is observing a sharp increase of 3 points within a few days since the market was at 65 points.
In BSV price, the sellers are dominating the majority of major cryptocurrency exchange platforms by 50 to 56%, as per Coinglass.
Technical Analysis
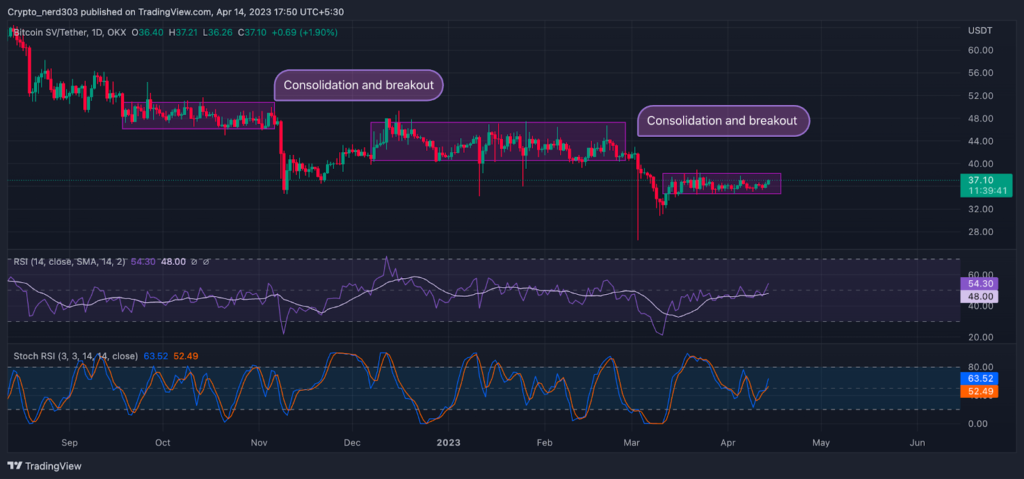
The RSI line is consolidating near the median line and it is moving within a narrow range. At present the RSI is bullish. The current value of the RSI line is 54.30 points, while the 14 SMA is providing support at 48.00 points. The stochastic RSI is crossing above the median line. Although it is making a lower high and lower low, chances are that it may continue its previous pattern.
Conclusion
As of now, BSV price is currently trading within a narrow consolidation pattern. If the historical price action is observed, it shows the price has been moving within a particular pattern of consolidation and breakout, where the price consolidates; taking resistance from the 100 EMA followed by a breakout.
This pattern was seen in mid-September then at December-end. Hence, it can be estimated that the price might follow the pattern and after making a consolidation, it can make a bearish breakout.
Technical levels –
Support -$32 to $35
Resistance – $40 to $52
Disclaimer
The views and opinions stated by the author, or any people named in this article, are for informational purposes only, and they do not establish financial, investment, or other advice. Investing in or trading crypto assets comes with a risk of financial loss.

Andrew is a blockchain developer who developed his interest in cryptocurrencies while pursuing his post-graduation major in blockchain development. He is a keen observer of details and shares his passion for writing, along with coding. His backend knowledge about blockchain helps him give a unique perspective to his writing skills, and a reliable craft at explaining the concepts such as blockchain programming, languages and token minting. He also frequently shares technical details and performance indicators of ICOs and IDOs.


