
 Home
Home News
News

- 1 The EOS price is currently trading at $123.00 while seeing a change of 7.39% in 24-hour trading volume.
- 2 The asset is observing a decline of 0.71% in the last 24 hours.
- The EOS price is currently trading at $123.00 while seeing a change of 7.39% in 24-hour trading volume.
- The asset is observing a decline of 0.71% in the last 24 hours.
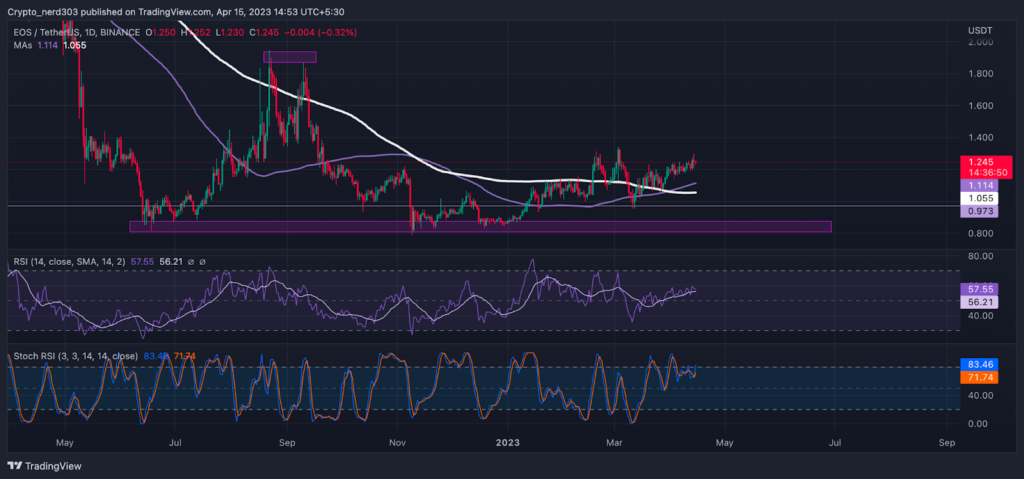
The investor’s sentiments regarding the EOS price are bullish. After gaining support from the $0.800 the price made an inverted head and shoulder pattern, seeing a sudden bullish surge where it rallied 95% above the support level. A small correction in the price is visible, indicating another successful attempt to continue its uptrend.

Although after reaching the prime resistance zone at 200 EMA, EOS price took a bearish rejection despite several attempts made by the buyers to make the crossover. Gaining rejection from 1.800, the sellers started stepping into the price action and the EOS price made a sharp bearish reversal; losing 48 of its overall value.

EOS Price Making a Bearish Ascending Flag Pattern
Technical Indicators’ Support Points
EOS is giving more preference to the Moving Averages rather than the Exponential Moving Averages. As of now, the EOS price is making a higher high and higher low pattern after taking support from the $0.800 price around January. Alternatively, the 100 Moving average has crossed above the 200 Moving Average. The price after taking support from 200 EMA is trading within a consolidation. As the price is under consolidation, there is a slight chance it can take a positive correction.
The crypto asset is currently taking support from the 100 and 200 Moving Averages respectively. The current support levels for the EOS price are around $1.114 and its major support level is at $1.055. The resistance point for the price of EOS is near $1.300 and its major resistance is at $1.600. The RSI line is moving above the median line. As of now, the RSI is presenting a bullish outlook. The value of the RSI line as of now is 57.55 points, while the 14 SMA is providing support at 56.21 points.
The stochastic RSI is trading at the overbought level of 83.46 points. The present situation suggests a bullish perspective although the stochastic RSI is trading near the oversold zone. The %K line has recently crossed above the %D line.
Conclusion
After the reversal, the EOS price gained constant buyer support from its previous support following which the price is making another attempt to cross above its major resistance level. Although this time the bullish attempt of EOS might be successful. As the price action and technical indicators are in the buyers’ favor.
Technical levels –
Support – $1.114 and $1.055
Resistance – $1.300 and $1.600
Disclaimer
The views and opinions stated by the author, or any people named in this article, are for informational purposes only, and they do not establish financial, investment, or other advice. Investing in or trading crypto assets comes with a risk of financial loss.

With a background in journalism, Ritika Sharma has worked with many reputed media firms focusing on general news such as politics and crime. She joined The Coin Republic as a reporter for crypto, and found a great passion for cryptocurrency, Web3, NFTs and other digital assets. She spends a lot of time researching and delving deeper into these concepts around the clock, and is a strong advocate for women in STEM.


