
 Home
Home News
News
- 1 Polkadot was at $6.80, increasing 1.96% during the intraday trading session and trading above the primary resistance.
- 2 The 24-hour low of DOT was $6.66 and the 24-hour high of DOT was $6.85.
- 3 The Polkadot token price is above 20, 50, 100, and 200-Day EMA.
The pair of DOT/BTC was trading at 0.000224 BTC with a rise of 2.13% over the intraday trading session. In 2022, the DOT price was mainly influenced by sellers, leading to the token dropping below its primary support towards the end of the year and remaining there. This indicates a significant occurrence of short-selling during that period. As can be seen over the daily time frame chart as the token made it’s new 52-week low near the end of the year.
However, from the beginning of 2023, the token started to rise, thanks to the presence of buyers who were active in the market. With their support, the token managed to break through its primary support and resistance levels and even reached its secondary resistance of $7.92. But, once the token tested the secondary resistance level, sellers became dominant and pulled the DOT price into a downtrend, which can be observed on the daily time-frame chart.
Polkadot price prediction suggests that if the buyers maintain the momentum which helped the DOT token in breaking out of its consolidation phase then it may show a rally toward the secondary resistance level. However, if sellers became dominant again in the market then the token price may face another downtrend over the daily trading chart.

The trading volume of the token decreased by 23.33% in the last 24 hours, indicating no relationship between the trading volume and the price of DOT, indicating a possible bearish reversal.
Polkadot Technical Analysis
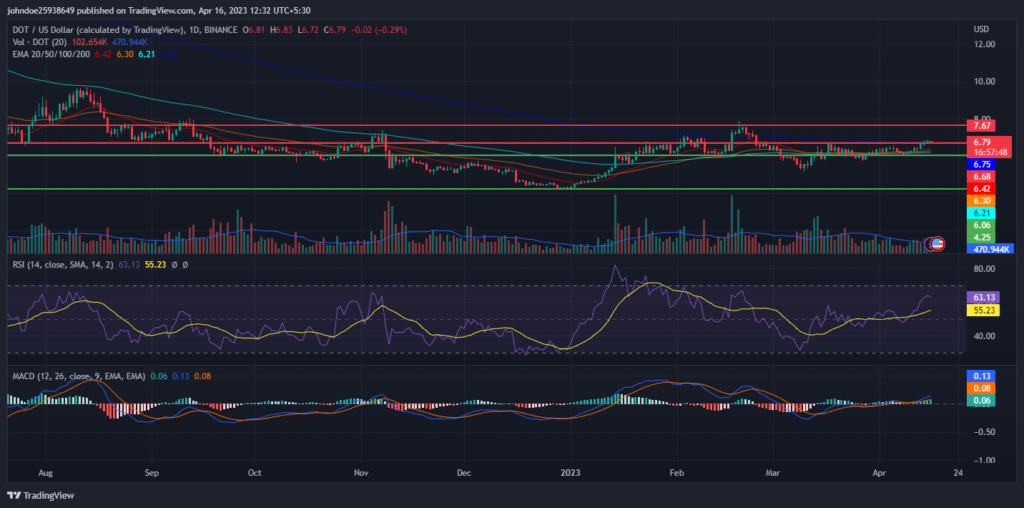
The Relative Strength Index (RSI) is decreasing in the overbought zone and might show a negative crossover. This suggests the sellers are in the majority of the market and pushing DOT downwards. The current value of RSI is 63.13, which is above the average RSI value of $55.23.
However, MACD and the signal line are increasing and are above zero which indicates the bullish intent in the market as can be seen over the daily time-frame chart.
Conclusion
Polkadot price prediction suggests that if the buyers maintain the momentum which helped the DOT token in breaking out of its consolidation phase then it may show a rally toward the secondary resistance level. The sudden decrease in the trading volume shows negative market sentiment toward the DOT token.
Furthermore, RSI is decreasing in the overbought zone suggesting weakness in the bullish intent. However, MACD is trading above zero over the daily trading chart showing strength in the bullish intent in the market. Traders should make the trades carefully in the market.
Technical Levels
Resistance level- $7.06 and $7.92
Support level- $6.06 and $4.25
Disclaimer
The views and opinions stated by the author, or any people named in this article, are for informational purposes only, and they do not establish financial, investment, or other advice. Investing in or trading crypto assets comes with a risk of financial loss.
Steve Anderson is an Australian crypto enthusiast. He is a specialist in management and trading for over 5 years. Steve has worked as a crypto trader, he loves learning about decentralisation, understanding the true potential of the blockchain.


