- Adobe’s Stock price gained 18.96% in March 2023.
- Adobe Stock price sustained above 50 and 200 days EMA.
- ADBE stock formed a double bottom pattern, breaking the previous high.
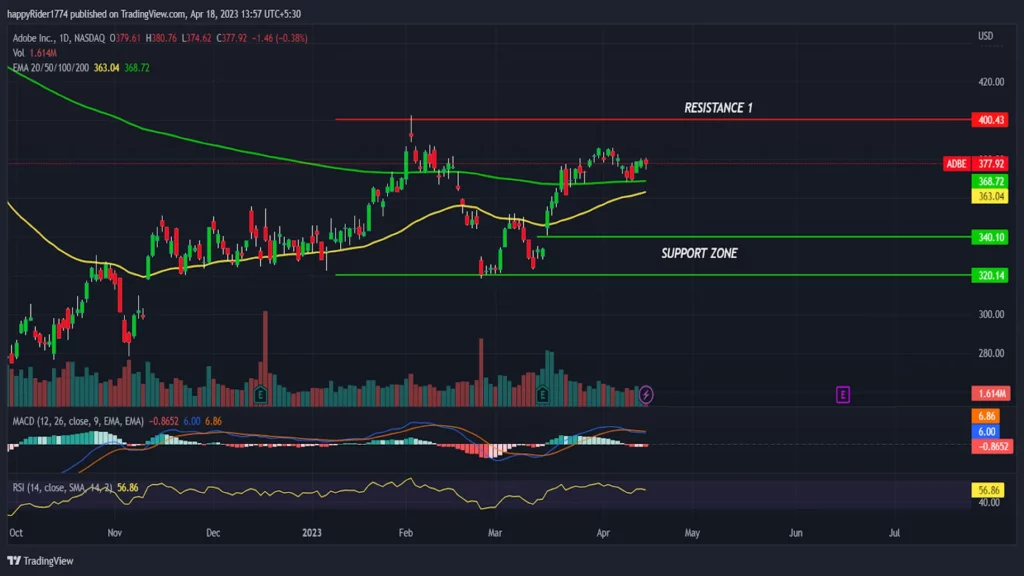
Adobe’s stock price gained 18.96% last month and showed a surprising rally from the demand zone at $320. ADBE stock formed a double-bottom bullish reversal pattern and broke out of the neckline hurdle. It shows that the buyers are more active than the sellers.
Adobe Inc. (NASDAQ: ADBE) released previous quarter earnings on May 15, 2023. The Company succeeded to met the EPS as well as revenue estimates. The prices reacted positively to the results.
Adobe stock price is sustaining above the 50 and 200-day EMAs, showcasing an uptrend. Moreover, both the EMAs are reversing upward and might display a golden crossover. However, the prices rallied more than expected in the previous month. So, minor consolidation or profit booking may also be visible in the coming weeks.
Adobe stock price closed the previous session at $377.92 with an intraday decline of -0.38% and market capitalization at $173.35 Billion. At the beginning of February, Adobe’s stock price attempted to break the $400 hurdle but got rejected and formed a long-tail bearish candle. ADBE stock consolidated for a few days hoping for follow-up momentum. However, the market took the opposite direction, and prices began to decline, forming lower low candles.
Will Adobe Stock Price Break $400 or Retrace?

NASDAQ: ADBE daily chart by TradingView
Adobe Stock price corrected 20% from the swing high, distributing investor sentiment. The downfall halted near $320.00, and slowly and steadily prices recovered by forming a double bottom pattern.
The ADBE stock price is near its previous highs and consolidates in the narrow range. Till the price sustains above $360.00, the stock will be buyer dominated. It increases the possibility of reaching $400 and expanding above. On the other hand, if the price drops below $360.00, the bears may drag it down to test the previous lows at $340.00 and $320.00.
ADBE Stock Price Overextended?
ADBE stock price has formed a Doji candle weekly over the past three weeks. It shows Adobe’s stock price is overextended and is likely to consolidate for some time before deciding the further direction.
The MACD generated a negative crossover, but the curve is sloping sideways. It is also an indication of range-bound trading. The RSI at 56 is very close to the neutral territory denoting a balance between bullish and bearish positions.
Conclusion
Adobe Stock Price showed a surprising rally last month. It formed a double-bottomed bullish reversal, breaking the neckline hurdle and showing bullish strength. The technical analysis suggests that till ADBE stock price holds $360.0, the probability of reaching $400 is high. Moreover, if the overall market sentiment remains bullish, then a breakout of $400 could be recorded.
Technical levels
Resistance levels: $400.00 and $420.00
Support levels: $340.00 and $320.00
Disclaimer
The views and opinions stated by the author, or any people named in this article, are for informational purposes only. They do not establish financial, investment, or other advice. Investing in or trading crypto assets comes with a risk of financial loss.

Andrew is a blockchain developer who developed his interest in cryptocurrencies while pursuing his post-graduation major in blockchain development. He is a keen observer of details and shares his passion for writing, along with coding. His backend knowledge about blockchain helps him give a unique perspective to his writing skills, and a reliable craft at explaining the concepts such as blockchain programming, languages and token minting. He also frequently shares technical details and performance indicators of ICOs and IDOs.


 Home
Home News
News


