
 Home
Home News
News
- ETC price is currently trading at $22.07 with a 33% drop in the 24-hour trading volume.
- ETC price observed a decline of 1.43% in the last 24 hours.
- ETC price is likely to observe a major decline shortly.
Investor sentiments regarding the Ethereum Classic price are bullish. The ETC Price is trading in the supply zone after making a bullish rally of 43%. As of now, the price is taking severe resistance from the 200 EMA on the daily time frame. Although the price gained buyers’ strong support around mid-April where after making a bullish move they might face rejection from the 200-day EMA.
The price of Ethereum has been trading under an extremely bullish trend since early July last year. After taking resistance from the $44 mark, the price came under a bearish trend where it crossed below the major key averages producing a death cross. The price lost more than 60% percent of its value in the bear trend.

ETC Price May Make a Bearish Move
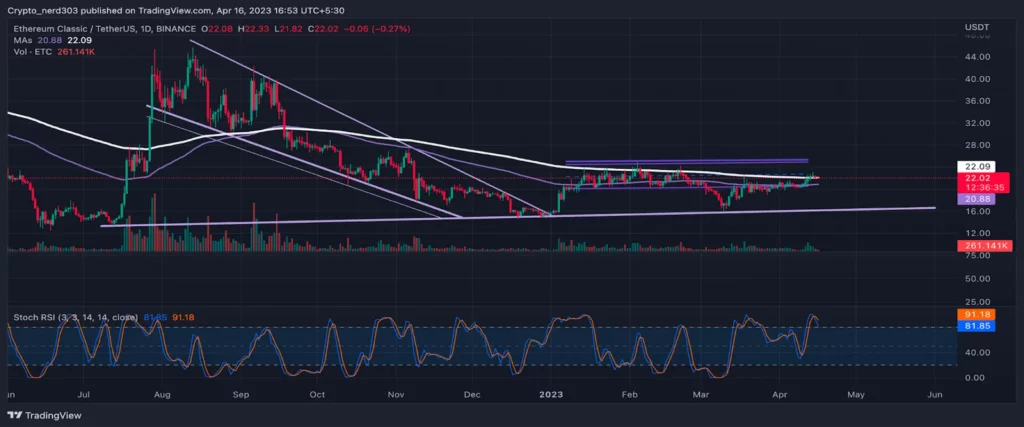
Source: ETC/USDT by TradingView
However, the ETC price broke the bearish trend with a strong bullish candle and made an extremely bullish rally, where it gained more than 60% of its value back. After facing resistance from the $24 level, the price started consolidating. ETC broke down 25% after breaking the support level.
The stochastic RSI is currently trading near the overbought levels around 91.18 points. While the %K and %D lines are already taking a bearish reversal from the supply zone, the stochastic RSI is suggesting that the price can soon take a bearish reversal from the recent rejection point.
The bears are currently dominating the majority of the Etheriam price action, as per Coinglass by 50 to 59%.
Conclusion
At present, the ETC price is facing severe resistance from the 200-day EMA. If the price takes a rejection from current levels with strong momentum, then it can make a bearish correction of 26% in the near future. The oscillators are also trading near the supply zone while the making of a red candle from the resistance point seems to strengthen the analysis.
Technical levels
Support – $20.88 and $16.00
Resistance – $22.09 and $28.00
Disclaimer
The views and opinions stated by the author, or any people named in this article, are for informational purposes only, and they do not establish financial, investment, or other advice. Investing in or trading crypto assets comes with a risk of financial loss.

Nancy J. Allen is a crypto enthusiast, with a major in macroeconomics and minor in business statistics. She believes that cryptocurrencies inspire people to be their own banks, and step aside from traditional monetary exchange systems. She is also intrigued by blockchain technology and its functioning. She frequently researches, and posts content on the top altcoins, their theoretical working principles and technical price predictions.


