
 Home
Home News
News

- The KAVA is above the Exponential Moving Average of 20,50 and 100 days.
- The current price of KAVA is approximately $0.9339, with an incline of 0.20% during the last intraday trading session.
- The pair of KAVA/BTC is around 0.00003092 BTC, with a decline of 2.01% in the last 24 hours.
KAVA Price Prediction A cryptocurrency has been showing an upward trend in its price lately. breaking the bullish trend. Overall, the trend for KAVA seems to be upward, but it is important to consider the possibility of bears manipulating the market and causing a sharp decline in price. The recent bullish trend in KAVA has resulted in a mixture of positive sentiment and occasional disagreements between buyers and sellers.

The current price of KAVA is approximately $0.9339, with a slight incline of around 0.20% in the last intraday trading session. However, the pair of KAVA/BTC is approximately 0.00003092 BTC, showing a decline of 2.01% in the last 24 hours. This trend has caused minute conflicts between the bulls and bears, and it seems the bears are getting weaker as the selling pressure is chasing the downward trend.

If the Bulls plan for KAVA, it has the potential to gain more. With such potential, it may reach the primary resistance of $1.12 and possibly even break up to the secondary resistance of $1.58. However, if the bears come to manipulate the market with new strategies which the bulls are not aware of, then this will be a harsh defeat to the bulls. The price may reach the primary support of around $0.78, and it may fall up to the secondary support of $0.51 due to such a fatal defeat by bears.

Source: KAVA/USD by TradingView
The decrease in the volume of KAVA during the intraday trading session is approximately 0.84%, and the volume-to-market cap ratio is 0.0367. The continuous decrease in the volume of the coin indicates that the short-selling pressure is increasing. The bulls have been trading, and the bullish trend is currently in motion.
The Technical Analysis of KAVA
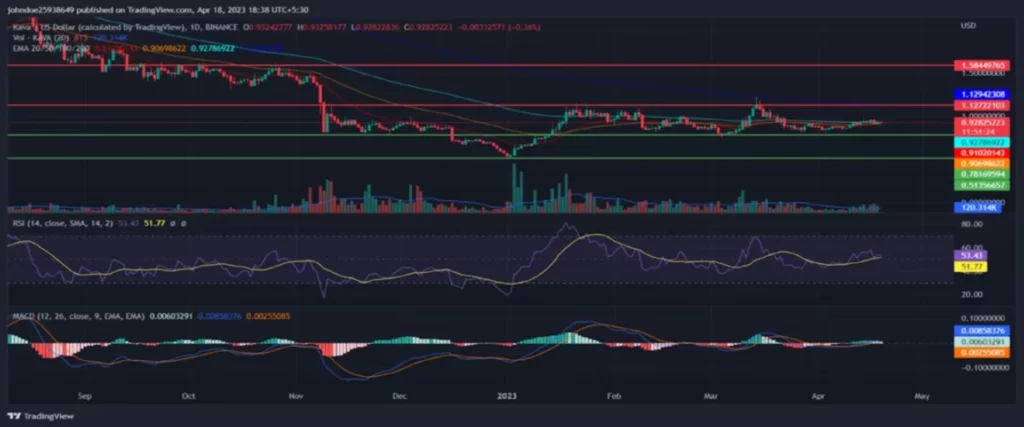
Source: KAVA/USD by TradingView
The technical indicator shows the following: The Relative Strength Index seems to be moving towards neutrality. The current Relative Strength Index is in the overbought zone, the average RSI is 51.73, and the current RSI is 52.95. The price of the coin is above the Exponential Moving Average of 20,50 and 100 days. And the coin still has to be lagging behind the 200 Daily Moving Average. The bears and bulls are trying to meet the expectations of investors, and KAVA investors are eagerly waiting for any directional change over the daily price chart.
Conclusion
KAVA Price Prediction has been showing an upward trend, but it’s important to consider the possibility of bears manipulating the market and causing a sharp decline. The current price is around $0.9339, with a slight incline during the last intraday trading session. The pair of KAVA/BTC is around 0.00003092 BTC, showing a decline in the last 24 hours.
Technical Levels
Support Levels: $0.78 and $0.51
Resistance Levels: $1.12 and $1.58
Disclaimer
The views and opinions stated by the author or any people named in this article about KAVA Price Prediction are for informational ideas only. They do not establish financial, investment, or other advice. Investing in or trading crypto assets comes with a risk of financial loss.

With a background in journalism, Ritika Sharma has worked with many reputed media firms focusing on general news such as politics and crime. She joined The Coin Republic as a reporter for crypto, and found a great passion for cryptocurrency, Web3, NFTs and other digital assets. She spends a lot of time researching and delving deeper into these concepts around the clock, and is a strong advocate for women in STEM.


