
 Home
Home News
News

- LINK price dropped by more than 7% in the intraday session.
- The present drop can set a bearish outlook for Chainlink.
Chainlink drops by more than 7% in the intraday session after a bullish trend for several days in the past week. LINK price rose last week by about 19% and set a bullish momentum in the price action. The present drop in price can set the price in a severe downtrend and test new support levels. The fall in Chainlink can worry the investors and cause a panic sell-off amongst the holders of LINK. The price action also fades the projection of the price reaching $10.

The Picturesque
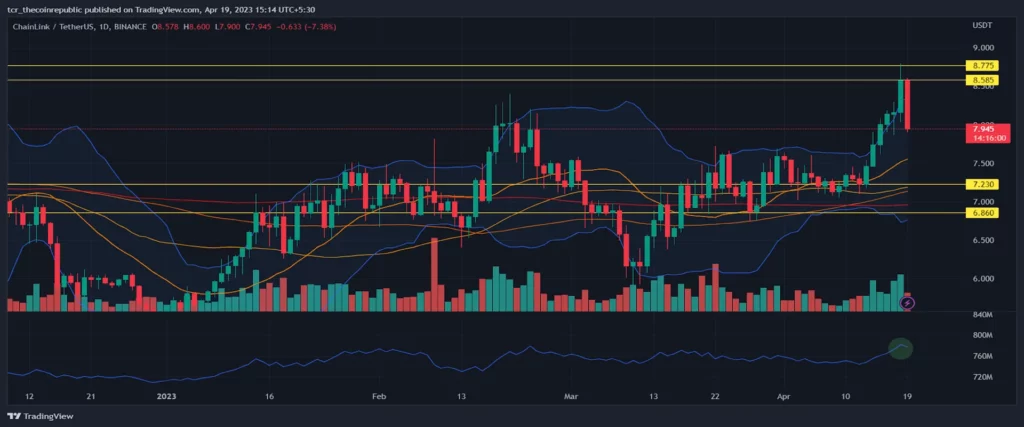
Source: LINK/USDT by TradingView

LINK price dropped by more than 7% in the past 24 hours and broke the prolonged uptrend formed last week. The volume signals at increasing selling pressure amongst the investors. Although the current price action occurs above the EMA ribbon, the falling price can soon reclaim it, turning the trend bearish. The OBV observes a downtick and suggests the market could be unfavorable for Chainlink. The Bollinger Bands diverges widely, reflecting the ongoing volatility in LINK price.
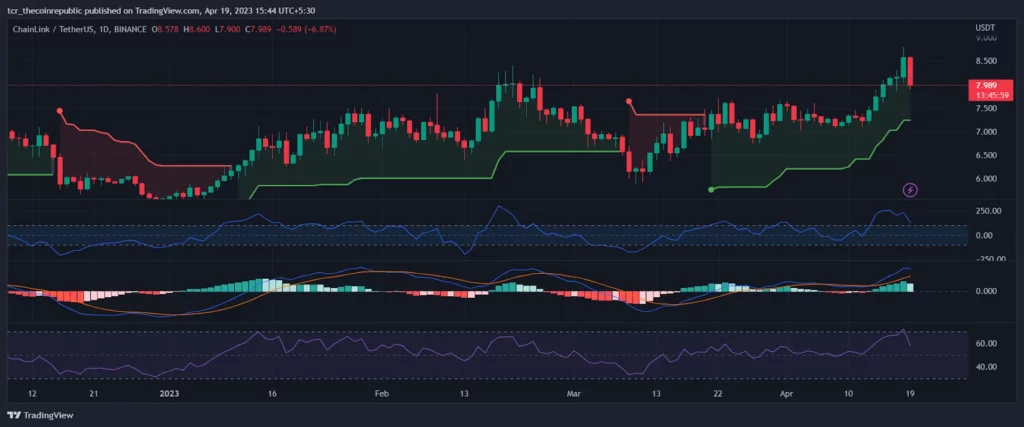
Source: LINK/USDT by TradingView
The fall in LINK price can break the current bullish trend formed by the Super Trends, and turn into a bear swing. The CCI falls, but still remains in the 100-range displaying a positive gap between the present price and historical prices. The MACD narrows the positive divergence and begins to record descending buyer bars. The RSI drops from the overbought zone to the 60-range, suggesting a declining buyer interest in LINK.
The Peephole
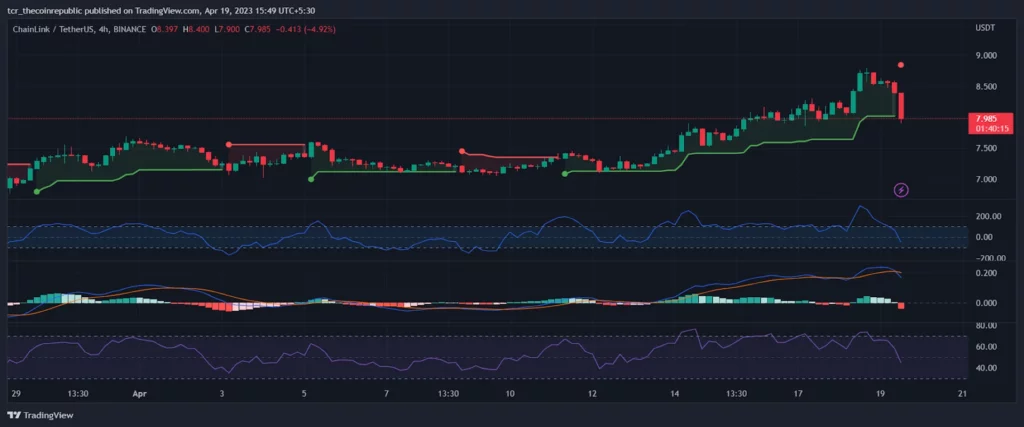
Source: LINK/USDT by TradingView
In the four-hour time frame, LINK price has begun the bearish trend and ended the bullish momentum, as per Super Trends. The CCI drops and is about to reach negative 100, reflecting the negative difference between the present price and historical prices.
The MACD forms bearish divergence and records tall seller bars in the region below the zero-histogram mark. The RSI plummets to the 45-range to signify the increasing selling pressure in the market.
Conclusion
Chainlink witnessed a massive drop of more than 7% in a single trading session. The drop is most likely to cause panic selling pressure, making the investors worrisome. The bullish trend has begun to transform into a bearish regime and can form a falling price pattern. The support near $7.230 can be relied on, but if breached can test deeper levels.
Technical Levels
Support levels: $0.08135 and $0.07295
Resistance levels: $0.09600 and $011455
Disclaimer
The views and opinions stated by the author, or any people named in this article, are for informational purposes only and do not establish financial, investment, or other advice. Investing in or trading crypto assets comes with a risk of financial loss.

With a background in journalism, Ritika Sharma has worked with many reputed media firms focusing on general news such as politics and crime. She joined The Coin Republic as a reporter for crypto, and found a great passion for cryptocurrency, Web3, NFTs and other digital assets. She spends a lot of time researching and delving deeper into these concepts around the clock, and is a strong advocate for women in STEM.


