
 Home
Home News
News

- The ZIL’s price is moving ahead of the 20,50,100,200 Daily Moving Average.
- The current price of Zilliqa is around $0.03297, with a gain of 5.20% during the last intraday trading session.
- The pair of ZIL/BTC is approximately at 0.000001091 BTC, with an increase of 2.22% in the last 24 hours.
The increase in Zilliqa price is a significant victory for the bulls. The price is following the upward trend, and how successfully the bulls execute every strategy, it would appear that the bears have given up for the day. The bear’s lack of movement greatly benefits the bulls in their goals, and they are completing them very fast. The strategies of bulls have worked after a long time, bringing a good call for the investors. Investors are watching for the upward trend as the coin was into the bearish trend. We must now wait and observe the bears’ upcoming movie. Will the bullish trend continue, or will the bears drive the price of ZIL to their desired targets?

The current price of the Zilliqa is at $0.03297, with an increase of 5.20% during the intraday trading session. The pair of ZIL/BTC is currently at 0.000001091 BTC, with a rise of 2.22% in the last 24 hours. It seems that the bulls are trying to enter the trade. The primary resistance is at approx for $0.0355 if the bullish trend continues, then the price can reach the secondary resistance, which is approximately $0.0396. And if bearish dominance continues, the price may follow a downward trend. It may reach the support of approx $0.0290. If the downward trend continues, it can contribute to the reversal of price, and the price can reach secondary support, which is around $0.0255.

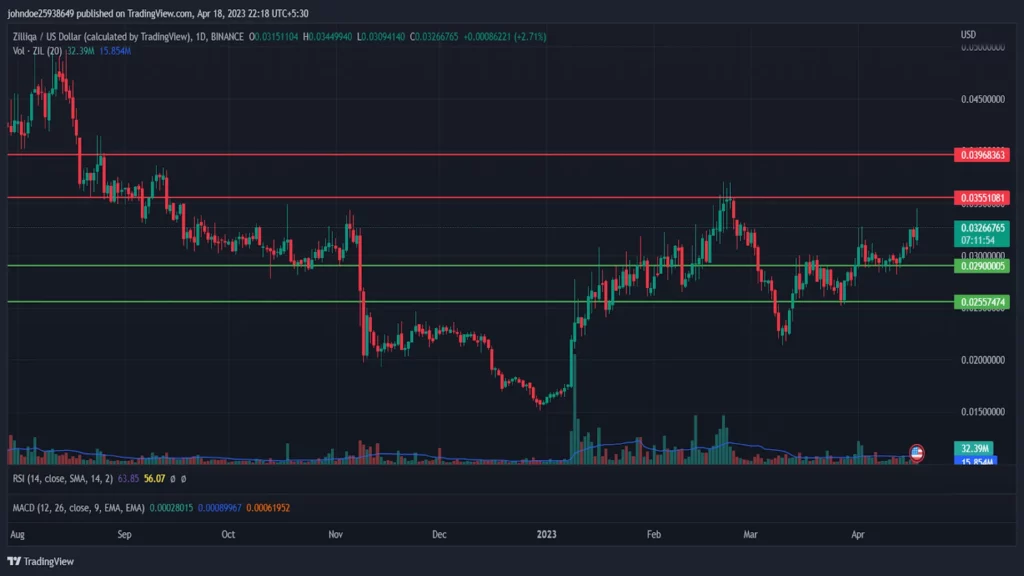
Source: ZIL/USD by TradingView
The ZIL volume has increased by approximately 68.59% in the last 24 hours. The volume-to-market cap ratio is around 0.1852. The increase in volume clearly shows that the selling pressure has decreased, and it seems volume is getting back on track, as the buyers are working too hard to increase the buying.
The Technical Analysis of ZIL
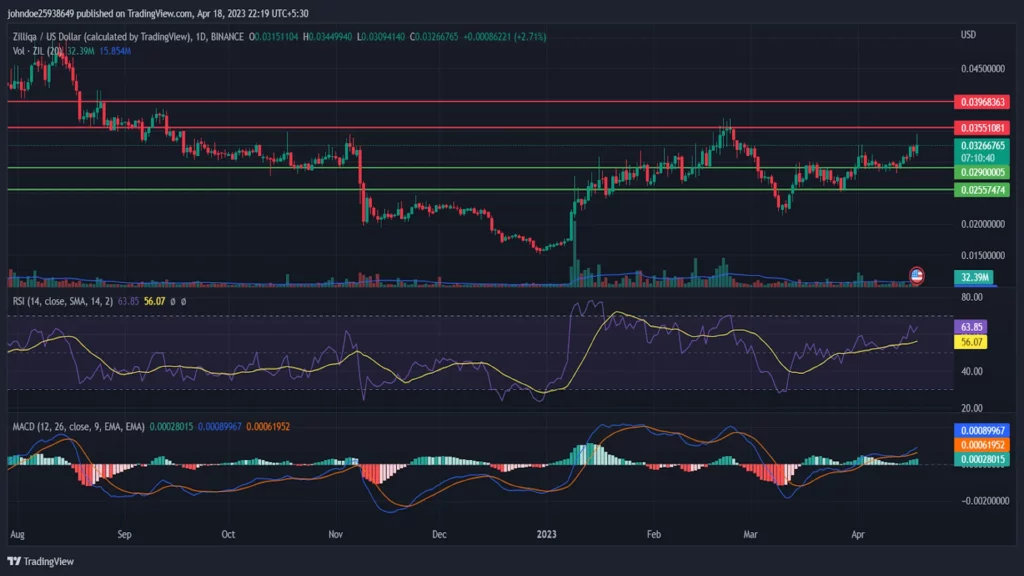
Source: ZIL/USD by TradingView
The technical indicator shows that: The relative strength index is getting closer and closer to being overbought. The current RSI, which is 63.85, is surfing above the average RSI, which is 56.07. The Bulls worked hard to move the RSI into the overbought zone. And the coin has been dragged to the overbought zone. The selling is getting weaker day by date sellers must show some interest for the investors to get on either side. The bears will have to work harder to get the RSI to neutral. The ZIL’s price is moving ahead of the 20,50,100,200 Daily Moving Average.
Conclusion
The price of Zilliqa (ZIL) has been increasing steadily, and the bulls seem to be achieving their desired targets with each strategy they execute. However, whether the bears will get into action and drive the price down remains to be seen. The current price of ZIL is around $0.98, with a gain of 5.20% during the last intraday trading session. The technical indicators suggest that the RSI is in the overbought zone, and the bears must work harder to neutralize it.
Technical Levels
Support Levels: $0.0290 and $0.02555
Resistance Levels: $$0.0355 and $0.0396
Disclaimer
The views and opinions stated by the author, or any people named in this article, are for informational ideas only. They do not establish financial, investment, or other advice. Investing in or trading crypto assets comes with a risk of financial loss.

Nancy J. Allen is a crypto enthusiast, with a major in macroeconomics and minor in business statistics. She believes that cryptocurrencies inspire people to be their own banks, and step aside from traditional monetary exchange systems. She is also intrigued by blockchain technology and its functioning. She frequently researches, and posts content on the top altcoins, their theoretical working principles and technical price predictions.


