
 Home
Home News
News
- The AVAX price is currently trading at $18.82 while seeing a change of 20.41% in 24-hour trading volume.
- AVAX’s price is observing a decline of 3.75% in the last 24 hours.
At present, the AVAX price is trading within a sideways range on the daily timeframe. The price of AVAX has been making multiple attempts to break above its major key resistance level at $22.00 but as of now, it has not been successful in breaking above it. The price has been gaining consistent buyer support from the base level of the range which suggests that investors are bullish regarding the AVAX token.
In the longer timeframe, AVAX price is making a bullish inverted head and shoulder pattern. Where on the other hand RSI line is trading on a bullish trend after giving a positive crossover above 14 SMA. Although the stochastic RSI line is at the oversold levels.
AVAX price trading in a bear trend near the support level (Daily Timeframe)
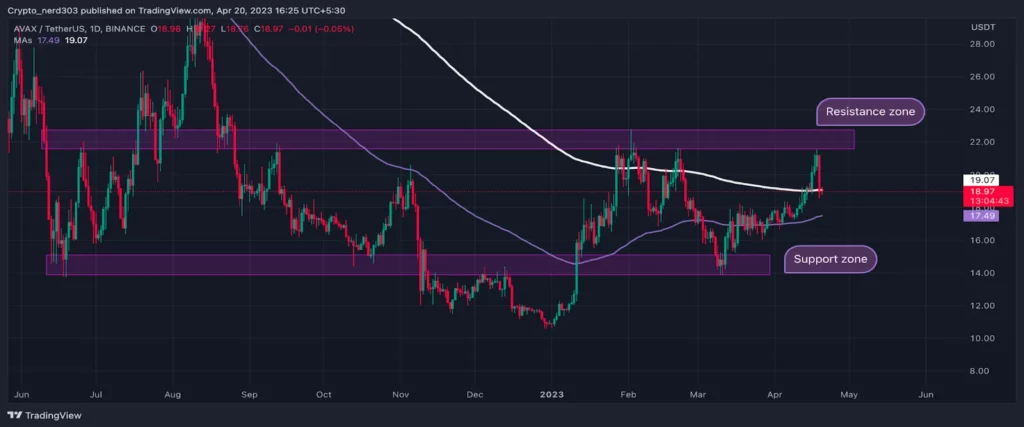
Source: AVAX/USDT by TradingView
The price of AVAX after making a bull rally of 40% faced severe resistance from the price of $21.00 where it also made a double top pattern. A double-top pattern is a bearish often formed on top of a bull trend. After making an attempt to cross the resistance at the price of $21.00 the price could not succeed.
Although, followed by a correction of 19% it made another attempt to make a breakout, however, the AVAX price took a final rejection with a downturn of 30% breaking below the neckline with strength.
In a previous analysis, when the price was trading near $14 it was predicted that after taking support from this level AVAX can make a bullish turn of 54% with the support of oscillators.
Technical Analysis (On 1 Day Timeframe)
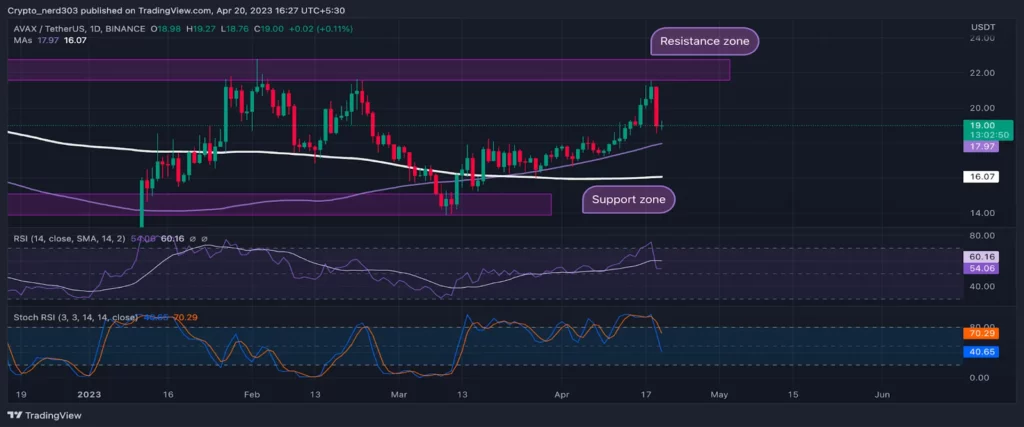
Source: AVAX/USDT by TradingView
The current support level for the price is at $18.00 while its next support level is around $14.00. The recent resistance level is around $22.00 which is 17% above the current price.
The RSI line after taking rejection from 80.00 points is trading above the median line around 54.06 and the 14 SMA is proving resistance to the RSI line trading at around 60.16 points. The stochastic RSI has also given a negative intersection between %K and %D; crossing below the median line.
Conclusion
The AVAX price after making a bullish rally is trading near the supply zone. Recently, after taking rejection from $22.00 the price made a huge bearish engulfing candle. The red engulfing candle is indicting a bearish reversal.
Technical levels –
Support – $18.00 and $14.00
Resistance – $22.00
Disclaimer
The views and opinions stated by the author, or any people named in this article about AVAX Price, are for informational purposes only, and they do not establish financial, investment, or other advice. Investing in or trading crypto assets comes with a risk of financial loss.

With a background in journalism, Ritika Sharma has worked with many reputed media firms focusing on general news such as politics and crime. She joined The Coin Republic as a reporter for crypto, and found a great passion for cryptocurrency, Web3, NFTs and other digital assets. She spends a lot of time researching and delving deeper into these concepts around the clock, and is a strong advocate for women in STEM.


