
 Home
Home News
News
- IOTA was currently at $0.2082, which decreased by 8.44% during the intraday trading session.
- The IOTA/BTC pair is trading at approximately 0.000007224 BTC, declining about 3.79%.
- The current IOTA price is below 20, 50, 100, and 200-Day DMA.
The price of IOTA cryptocurrency is currently caught in a roller coaster ride. The bulls and bears are hustling to pull the price towards their respective zones, neither willing to give in easily. This has created an interesting scenario for investors eagerly waiting to see who will come out on top.

The price of IOTA is around $0.2082, which decreased by 8.44% during the intraday trading session. Meanwhile, the IOTA/BTC pair is trading at approximately 0.000007224 BTC, declining about 3.79%. If the bulls do not respond, the price may approach the primary support level of around $0.1982. However, if the bulls fail to act, the bears will likely push the price down to its secondary support level of $0.1870. On the other hand, if the bulls put in extra effort, they may take the price up to the primary resistance of $0.2321. If a bullish trend materializes, we may see the price rise further to the secondary resistance of $0.2738 on the daily price chart.

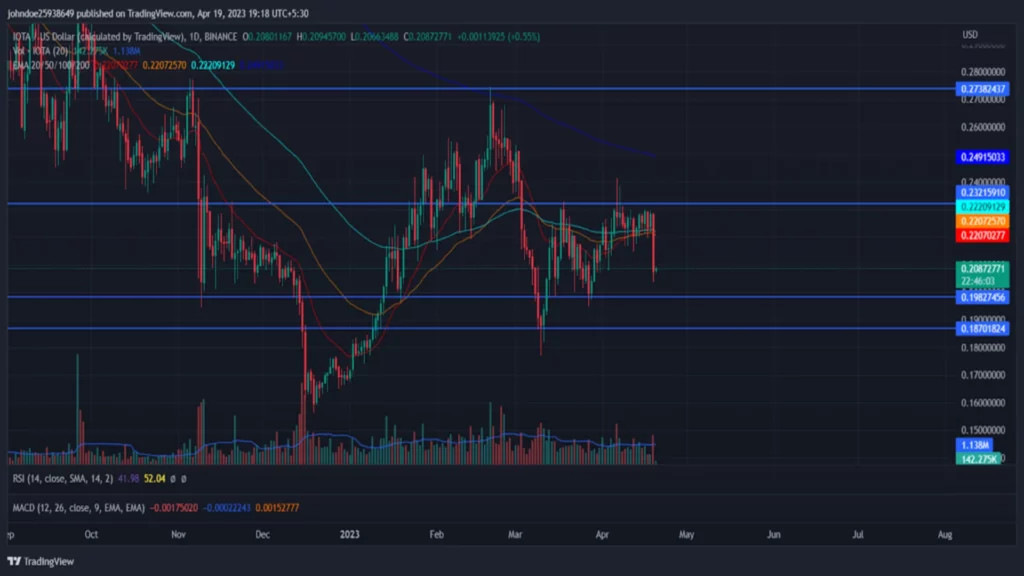
Source: IOTA/USD by TradingView
The decreasing volume of IOTA by approximately 0.04% during the intraday trading session indicates that bears are trying to enter the trade. This suggests that a strong bearish trend may be on the horizon. If the bulls take this for granted, it could lead to a fatal defeat for them. It remains to be seen who will come out on top, but the bulls must push themselves to match investors’ expectations. The volume-to-market cap ratio for IOTA is 0.0288.
The Technical Analysis of IOTA
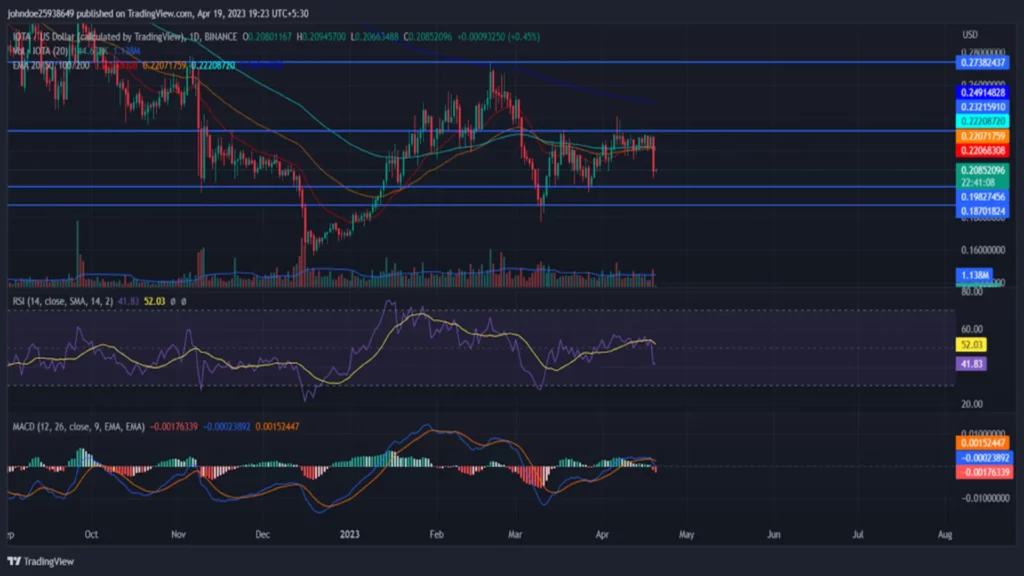
Source: IOTA/USD by TradingView
The technical indicator shows that the Relative Strength Index is in the oversold zone indicating the sellers. The current RSI is 42.11, and the average RSI is 52.05. As the RSI has returned from the overbought zone, The price of the coin is lagging behind the Daily moving average of 20,50,100,200 days. The MACD and MACD signal have intersected, giving a negative crossover.
Conclusion
The price of IOTA cryptocurrency is currently caught in a roller coaster ride. Both sides fight tooth and nail to push the price toward their desired zones. Investors are eagerly waiting to see who will come out on top. The bulls have work to do to match investor expectations and win the tug-of-war. IOTA was currently at $0.2082, which decreased by 8.44% during the intraday trading session.
Technical Levels-
Resistance level- $0.2321 and $0.2738
Support level- $0.1982 and $0.1870
Disclaimer-
The views and opinions stated by the author, or any people named in this article, are for informational purposes only and do not establish financial, investment, or other advice. Investing in or trading crypto assets comes with a risk of financial loss.

Nancy J. Allen is a crypto enthusiast, with a major in macroeconomics and minor in business statistics. She believes that cryptocurrencies inspire people to be their own banks, and step aside from traditional monetary exchange systems. She is also intrigued by blockchain technology and its functioning. She frequently researches, and posts content on the top altcoins, their theoretical working principles and technical price predictions.


