
 Home
Home News
News
- MINA price is currently trading at $0.758, with an increase of 111% in the 24-hour trading volume.
- MINA price observed a decline of 8.00% in the last 24 hours.
- The price of MINA can take a downturn shortly.
Recently, a bullish outbreak was observed in the MINA price amid a bearish investor outlook for the MINA network. The price of MINA is attempting to break below its 100-day EMA near the previous consolidation range. The price also made a rough head and shoulder pattern between February and March, with the shoulders being formed at $0.900 and the head around $1.200.
MINA Price Trades Within a Consolidation Range on the (Daily Timeframe)
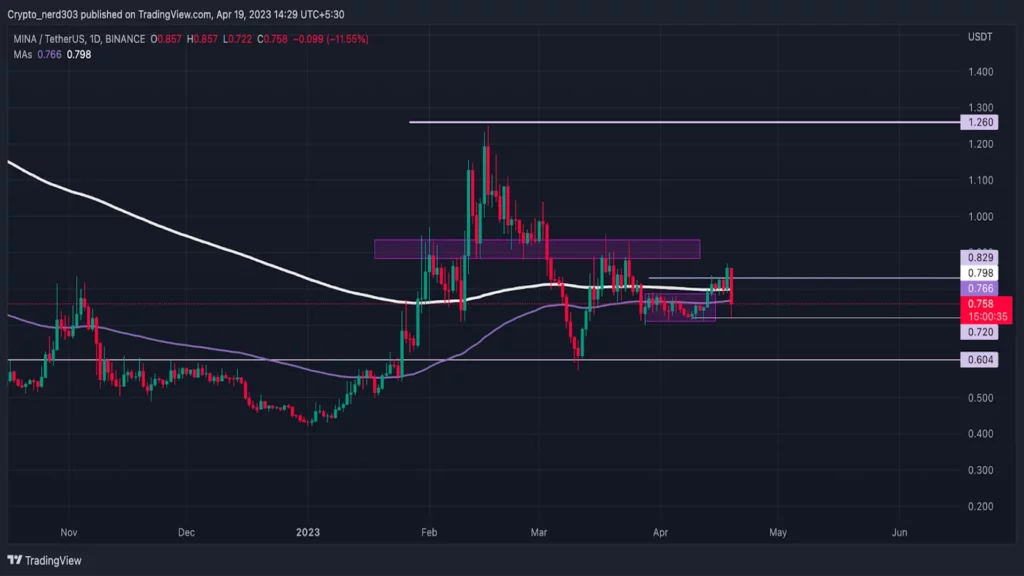
Source: MINA/USDT by TradingView
Around mid-February, the price of the MINA token took resistance from $1.200, breaking its bull trend. Following this, it made a downfall of 40%. MINA’s price made another attempt to resume its bullish trend by retesting its shoulder level. However, it could not sustain and made a bearish correction of 20%. The price is currently trading around $0.758 on the daily timeframe.
On the contrary, the 20/50/100/200 day EMAs are making a narrow convergence below $800. The price is currently crossing below the 100 and 200 EMAs.
The convergence of EMAs suggests a breakout, with the oscillators also giving ominous signals.
Technical Analysis (1-Day Timeframe )
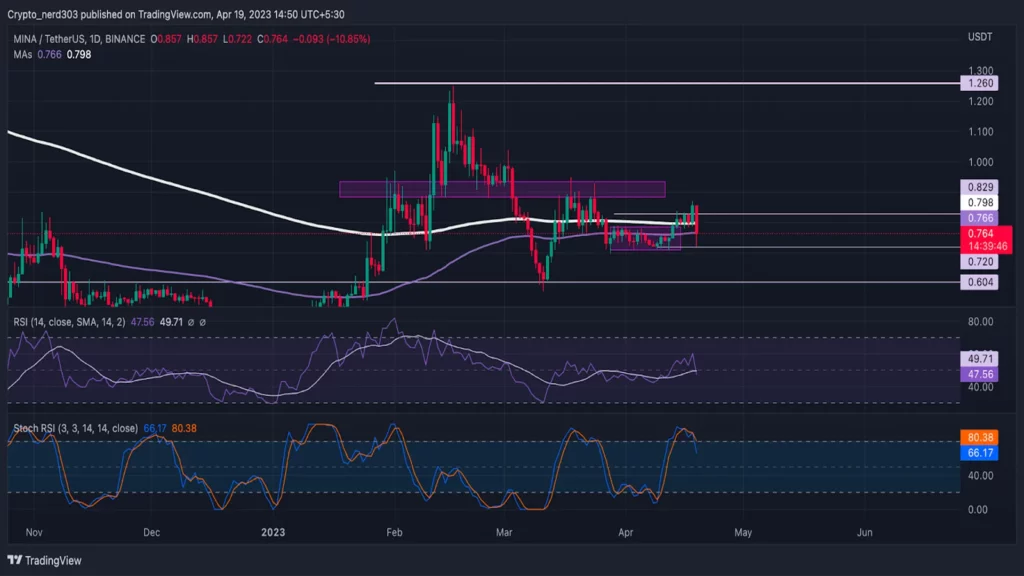
Source: MINA/USDT by TradingView
The RSI line currently crosses below the 14 SMA, making higher highs and lowers. The RSI value is 47.56 points giving a negative crossover below the SMA line around 49.71. Making a bearish curve suggests that the MINA price will move toward oversold levels.
The stochastic RSI line is taking a reversal from the supply zone. %K and %D lines have already given a bearish crossover. At present, the value of Stochastic RSI is trading around 66.17 points.
Conclusion
According to analysis, the MINA price is providing bearish indications. The breaking of 200 and 100 EMA suggests that this breakout can be bearish. The oscillators support this analysis. At present, the RSI is giving a negative crossover, while stochastic RSI is also making a negative intersection.
If the MINA price makes a bearish breakout, it can make a downward correction of almost 20% daily.
Technical levels –
Support $0.700 and $0.600
Resistance – $0.800 and $1.200
Disclaimer
The views and opinions stated by the author, or any people named in this article, are for informational purposes only and do not establish financial, investment, or other advice. Investing in or trading crypto assets comes with a risk of financial loss.

Andrew is a blockchain developer who developed his interest in cryptocurrencies while pursuing his post-graduation major in blockchain development. He is a keen observer of details and shares his passion for writing, along with coding. His backend knowledge about blockchain helps him give a unique perspective to his writing skills, and a reliable craft at explaining the concepts such as blockchain programming, languages and token minting. He also frequently shares technical details and performance indicators of ICOs and IDOs.


