
 Home
Home News
News

- Mina Price fell by 12% in the previous session and closed below the 200-day EMA.
- THe token faced resistance near $1.00 and is stuck in a narrow range.
- It is currently showing signs of long-term base formation.
MINA’s price fell by 12% in a single day and attempted to break down the lower consolidation range. MINA price rejected the $1.00 level and witnessed minor profit booking from the supply zone. Mina crypto struggles to keep the price above the 50 and 200-day EMAs showing buyer strength. However, both the EMAs are sloping sideways, which indicates prices lacked direction and are expected to consolidate for some more time.

The volume bars in the MINA crypto are declining as compared to previous months. It shows that fewer buyers and sellers are participating at the current price. Therefore, the price is stuck in a narrow range and will likely break either side soon.

MINA’s price is trading at $0.738 with an intraday decline of -1.60%. The 24-hour volume-to-market cap ratio stands at 0.073. The pair of MINA/BTC is trading at 0.00002560 with an intraday decline of -1.69%. The chart structure of the MINA/BTC pair is in a strong downtrend, and the prices are near the yearly lows. It shows a low correlation with the USDT pair.
At the beginning of March, the MINA price dropped below the $1.00 support and began to decline, forming lower lows. It also slipped below both EMAs triggering negative sentiment.
Will MINA Price Test the Previous Swing Low?
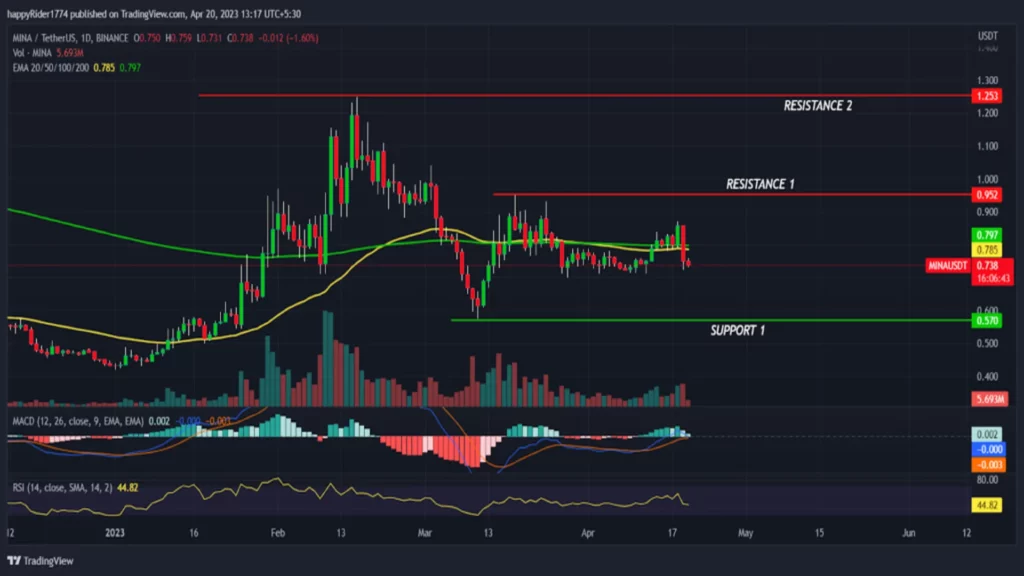
MINA/USDT daily chart by TradingView
MINA Price corrected 54% approx from the recent swing high at $1.253 and lost most of its previous gains. Around mid-March, the overall market sentiment improved, positively impacting Altcoin prices.
MINA price also took support at $0.570 and formed a bullish engulfing candle creating hopes for trend reversal. Later, prices showed a minor recovery and tried to regain the EMAs. However, the EMA was a strong hurdle, and prices failed to give the follow-up momentum. The technical analysis suggests MINA price is in the neutral zone, and the downside seems limited.
Will MINA price see a rebound from the swing low?
MINA price showed a sharp bounce from the demand zone. It indicates responsive buyers are active at lower levels. Therefore, if the correction continues, the price might test the previous swing low, but the probability of a bounce back will remain high. Technical indicators like the MACD curve are reversing down and on the way to generating a negative crossover. The RSI at 45 sloping sideways denotes neutral territory and the balance between bullish and bearish positions.
Conclusion
MINA price fell 12% on a single day and reverted to the lower consolidation range. If the sell-off continues, then prices might try to test the previous swing low at $0.570. However, the responsive buyers are active at lower levels, and the downside seems to be limited.
Technical levels
Resistance levels: $0.952 and $1.253
Support levels: $0.570 and $0.400
Disclaimer
The views and opinions stated by the author, or any people named in this article, are for informational purposes only. They do not establish financial, investment, or other advice. Investing in or trading crypto assets comes with a risk of financial loss.

Nancy J. Allen is a crypto enthusiast, with a major in macroeconomics and minor in business statistics. She believes that cryptocurrencies inspire people to be their own banks, and step aside from traditional monetary exchange systems. She is also intrigued by blockchain technology and its functioning. She frequently researches, and posts content on the top altcoins, their theoretical working principles and technical price predictions.


