
 Home
Home News
News

- The WBTC price is currently trading at $28265.2 while seeing a change of 61% in 24-hour trading volume.
- The WBTC price is observing a decline of 0.23% in the last 24 hours.
- Wrapped Bitcoin can make a bearish correction in the near future.’
Recently, the WBTC Price Analysis has been acquiring strong support from buyers since early January. Gaining a boost from the price of $16000 the WBTC price made an extremely bullish move of more than 42%; giving a golden crossover by crossing above all the major key averages. The sentiments of the investors seem to be bullish regarding the price of WBTC on the daily timeframe.

Despite the major trend being bullish, at present WBTC price is trading near the supply zone within an ascending consolidation channel. The ascending channel at the supply zone is making a bearish flag and pole pattern. This pattern is often observed in a bull trend before a correction.

WBTC Price Analysis trading under the supply zone on the (Daily Timeframe)
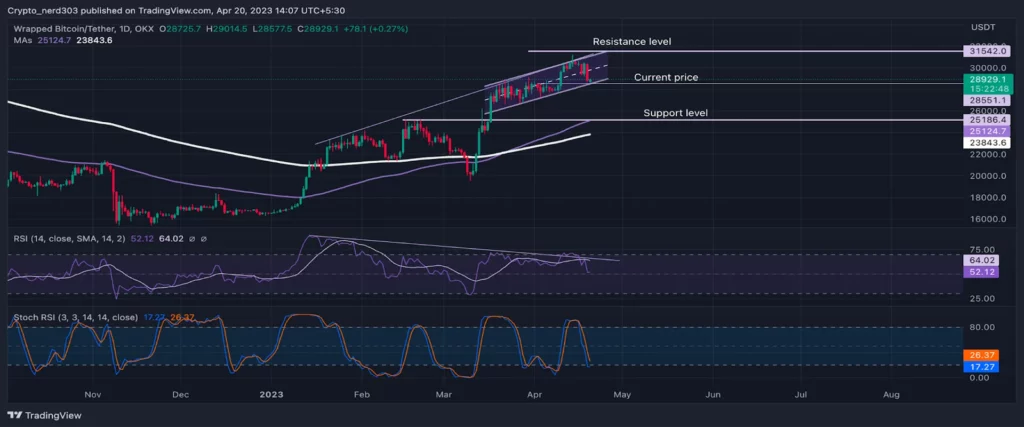
Source: WBTC/USDT by TradingView
This pattern can also be observed in the historical price action where after making an ascending consolidation channel, the price took a downward correction as shown in the illustration above. On a bigger time frame, the Oscillators are also moving in the oversold levels.
Although on a shorter timeframe, the price is giving consistent movement within a range. Presently, the price is trading near the demand zone of the consolidation channel and the stochastic RSI is following those movements closely.
Technical Analysis ( 1 Day Timeframe )
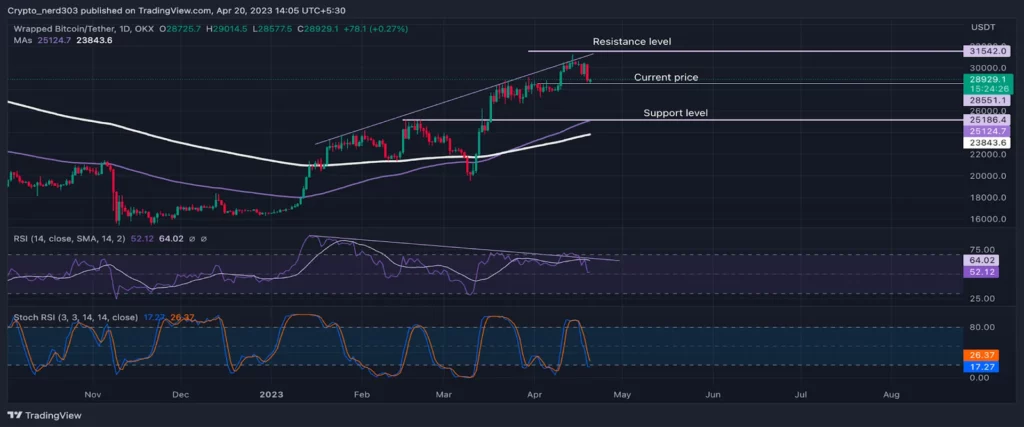
Source: WBTC/USDT by TradingView
The RSI line is currently making a bearish divergence. Where the WBTC price is making consistent higher high and higher low patterns trading on an uptrend, the RSI line is making a lower high and lower low pattern. This pattern is suggesting a change of trend in the one-day timeframe. The current RSI value is 52.12 points, which is facing resistance from the 14 SMA trending just above the RSI line, around 64.02 near the overbought level.
The stochastic RSI on the other hand is currently trading below 30 points at the oversold levels after taking rejection from 70 points. The buyers might prefer to wait for a bullish crossover between the %K and %D line before taking any action.
Conclusion
According to the WBTC Price Analysis, the RSI line and stochastic line are moving in contrast with each other. Where the RSI is giving bearish indications for the price Stochastic RSI is following the consolidation closely. If the price faces rejection from the current levels, it can make a downfall of 20% in the coming days. Its nearest support level is 100 EMA. And if it takes a reversal in the consolidation it can make a bullish rally of 9%.
Technical Levels
Support -$25186.0
Resistance – $31542.0
Disclaimer
The views and opinions stated by the author, or any people named in this article about WBTC Price Analysis are for informational purposes only, and they do not establish financial, investment, or other advice. Investing in or trading crypto assets comes with a risk of financial loss.

With a background in journalism, Ritika Sharma has worked with many reputed media firms focusing on general news such as politics and crime. She joined The Coin Republic as a reporter for crypto, and found a great passion for cryptocurrency, Web3, NFTs and other digital assets. She spends a lot of time researching and delving deeper into these concepts around the clock, and is a strong advocate for women in STEM.


