
 Home
Home News
News
- GRT – Ethereum correlation has suddenly surged in the past few days and is near 0.98.
- Technical indicators are favoring a downside momentum in price. It is down by 4.7% in the ETH pair.
The Graph is an indexing protocol for querying networks that enable it to build and publish Open API. It makes data easily accessible, helping developers to build new dapps. Anyone can build and publish an Open API called Subgraphs, which an application can query using GraphQL.

It accomplishes this by providing developers with a scalable and secure indexing protocol to access data from multiple blockchains and present it in a standardized format. It also has an open subgraph marketplace where developers can publish and sell to other developers.

The platform gives a much more collaborative space to build new dapps. Meanwhile, the GRT token is used to incentivize indexers and developers. The Graph has 129067 holders, which can see growth shortly. GRT has a total supply of 10 Billion tokens, with 8.9 Billion tokens circulating in the market.
The Graph has a market cap of $1.28 Billion and is ranked 42nd in the crypto-verse. The volume of the asset has seen a jump of 10% in the intraday session. The volume-to-market cap ratio of GRT suggests a consolidating range in price.
Bears Are Pushing GRT Down
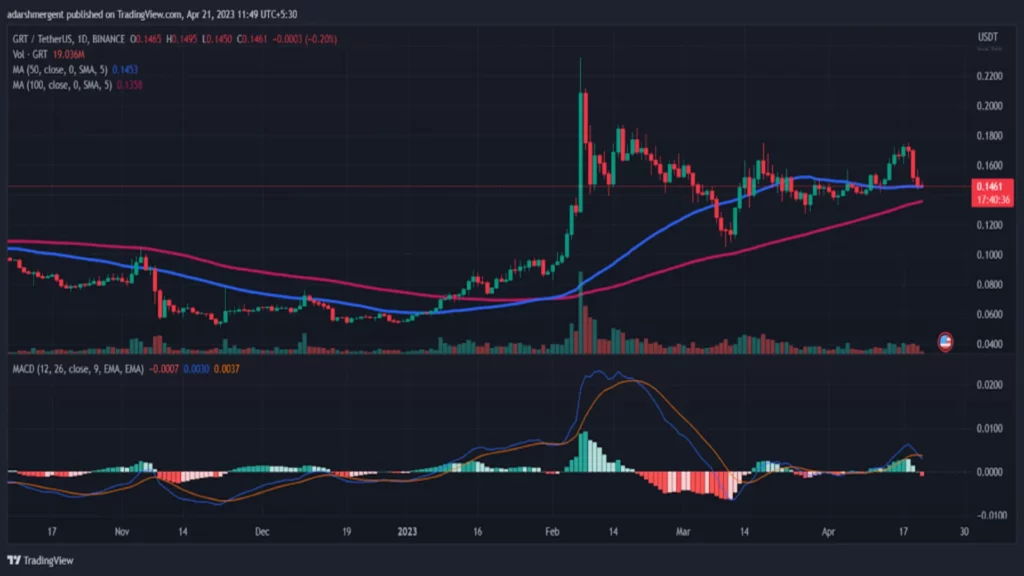
The weekly technical chart for GRT suggests consolidation in the price trend. The correlation between ETH and GRT has seen strong growth. It has risen from 0.5 to 0.96 in the past few days. There are strong bearish candles being formed in the daily chart. The upside trend of GRT can see a halt near the value of $0.18.
Meanwhile, the asset price support can be near $0.1. GRT is trading below the 50 and above the 100 Daily Moving Averages. The 100 DMA line can act as a support in case of downside trends.
MACD of the asset price suggests a consolidated trend in price. Bars of the Histograms favor a weak downside trend in price.
Summary
GRT has observed an increase in correlation with Ethereum over the past few days. The Graph price is seeing a bearish trend in price but can move to a new high in the future.
Technical Levels
Major Support:$0.1
Major Resistance:$0.18
Disclaimer
The views and opinions stated by the author, or any people named in this article, are for informational purposes only. They do not establish financial, investment, or other advice. Investing in or trading crypto assets comes with a risk of financial loss.

With a background in journalism, Ritika Sharma has worked with many reputed media firms focusing on general news such as politics and crime. She joined The Coin Republic as a reporter for crypto, and found a great passion for cryptocurrency, Web3, NFTs and other digital assets. She spends a lot of time researching and delving deeper into these concepts around the clock, and is a strong advocate for women in STEM.


