
 Home
Home News
News
- LDO price might make a bullish move shortly
- LDO price has been up by 4.88% in the last 24 hours.
The price of LDO is currently trading within a sideways range where the Investors’ sentiments are bullish as the price is getting constant support from the buyers near the demand zone.
After breaking above the $1.800 price point with a bullish momentum, the price started moving within a broadly sideways range. LDO has been making multiple attempts to breach its barrier near $2.800. The price of LDO was successful in reaching $3.200; after making a double-top pattern, the sellers started stepping into the action. Following a bearish pattern at the supply zone, the price lost 40% of its value. Since early January, the price of LDO has been trading above the 200 EMA; taking consistent support from it.
Technical Analysis ( 1 Day Timeframe )
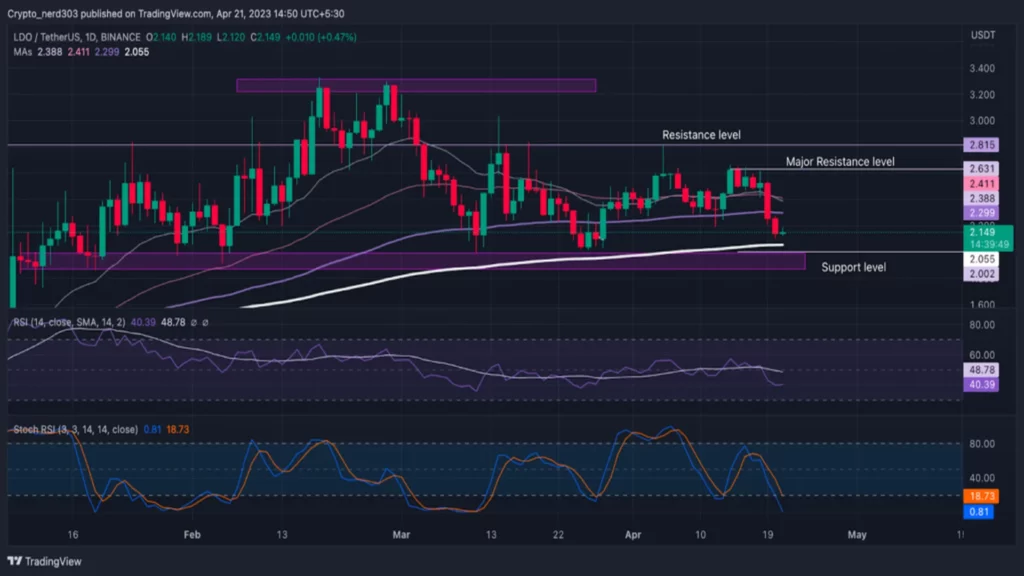
Source: LDO/USDT by TradingView
The price is trading just above its previous historical support zone. The Stochastic RSI and RSI oscillators are trading near the demand zone. The 20/30/50/100 EMA is trading in a bullish trend within an ascending order.
The current price of LDO is $2.149 while trading near the 200-day EMA, its current support level is $2.000, which is 5% below the current price, and the major support zone is %15 below at $1.800.
The most recent resistance for the LDO token is 23% above around $2.600, whereas its major resistance is 52% above the current price of $3.000.
The RSI line trades in the demand zone of around 39.42 points, near the oversold level. The 14 SMA trades near the median line at 48.74 points, providing resistance. The making of an upward curve near the demand zone suggests that the price may soon start making a bullish move.
The stochastic RSI is steadily moving toward the overbought zone. The %K line and %D line may soon give a positive intersection after taking a reversal from the 30 points. At present the value of Stochastic RSI is 18 points.
Conclusion
According to analysis, LDO price is trading on a major bull trend above all the major key indicators making consistently higher highs and higher lows. Currently, the price is trading near the demand zone, around 200 EMA. If the price finds buyers’ support at recent levels, it can make a bullish rally of more than 22% according to historical price action.
Technical levels –
Support – $2.000 and $1.800
Resistance – $2.600
Disclaimer
The views and opinions stated by the author, or any people named in this article, are for informational purposes only, and they do not establish financial, investment, or other advice. Investing in or trading crypto assets comes with a risk of financial loss.

Nancy J. Allen is a crypto enthusiast, with a major in macroeconomics and minor in business statistics. She believes that cryptocurrencies inspire people to be their own banks, and step aside from traditional monetary exchange systems. She is also intrigued by blockchain technology and its functioning. She frequently researches, and posts content on the top altcoins, their theoretical working principles and technical price predictions.


