
 Home
Home News
News
- The LTC price is currently trading at $89.89 while seeing a change of 22% in 24-hour trading volume.
- The LTC price has been observing a decline of 3.55% in the last 24 hours.
The LTC price has been trading on a strong bull for the last few months. Near early November, after taking support from $50, the price point surged up 74% within a few weeks, changing its trend in the bull’s favor. During this, the price crossed above all the major key averages giving a golden crossover.
The price of LTC made a bullish rally of 56% near mid-march, throughout which the price started moving within a narrow consolidation, making an ascending flag pattern. Followed by a sharp rejection from the previous high of LTC near $102.00, the price made a strong bearish engulfing candle on the daily timeframe, which itself was around 13 percent.
The LTC price is trading on an uptrend on the (Daily Timeframe)
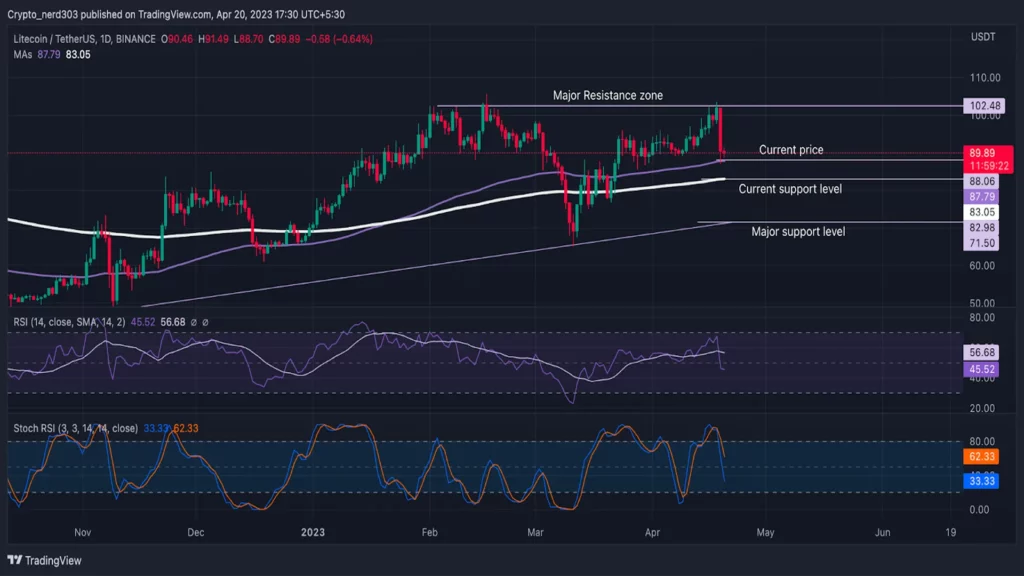
Source: LTC/USDT by TradingView
Currently, the LTC price is trading above all the major key 20/50/100/200 indicators; as the price has strong support levels below it, there are significant chances that the price can take a bullish reversal. If the price turns bullish, it can make a 12% rally. According to the historical price action, the price has constantly intercepted the EMI lines, which suggests that the current price is not respecting it. Hence it is possible that the price may continue its bearish trend after a small bullish move.
Although on the contrary, the making of the red engulfing candle after rejecting the resistance suggests that sellers are starting to step into the market. If the price takes rejection from the current levels, it can correct up to 10 to 20% according to the next support levels.
The RSI line has recently crossed below the 14 SMA, taking support from the median line. The current RSI value is 45.52 points, and the 14 SMA provides resistance around 56.68 points. However, making an upward curve near the median line suggests that it can take a retest from the 14 SMA before going to oversold levels.
The stochastic RSI line has already reversed from the overbought zone with a bearish crossover between the %K and %D lines. The current value of stochastic RSI is 33.33 points.
Conclusion
According to analysis, the overall trend for LTC price is bullish. As of now, the price is presenting two possible outcomes hence the buyers may prefer to wait for a confirmation of the trend before taking any action.
Technical levels –
Support -$83.0 and $82.0
Resistance – $102.00
Disclaimer
The views and opinions stated by the author, or any people named in this article, are for informational purposes only and do not establish financial, investment, or other advice. Investing in or trading crypto assets comes with a risk of financial loss.

Andrew is a blockchain developer who developed his interest in cryptocurrencies while pursuing his post-graduation major in blockchain development. He is a keen observer of details and shares his passion for writing, along with coding. His backend knowledge about blockchain helps him give a unique perspective to his writing skills, and a reliable craft at explaining the concepts such as blockchain programming, languages and token minting. He also frequently shares technical details and performance indicators of ICOs and IDOs.


