
 Home
Home News
News
- The APT price is currently trading at $10.14 while seeing a change of 21.0% in 24-hour trading volume.
- The APT price is observing a decline of 7.48% in the last 24 hour
The sentiments of the market regarding APT price are slowly moving toward the fear zone. investors are waiting on the sidelines for the appropriate opportunity to enter the market. The current price action is suggesting that the opportunity might present itself sooner than expected. However, keeping the overall market situation in the view the buyers may prefer a strong bullish indication before taking any action.
Most of the major cryptocurrencies in the market at present are trading near a fragile yet major support zone at the market. And as the price of APT moves in correlation with those Tokens their movements may be reflected in the price action of APT tokens.
The price of APT is at present trading near the demand zone at $10.0000 at present the price is a critical deciding factor. If it gains buyers’ support there these levels it may start trading on a bullish trend. Though if the price loses the support near this point it can make a bearish breakout.
Technical Analysis ( 1 Day Timeframe )
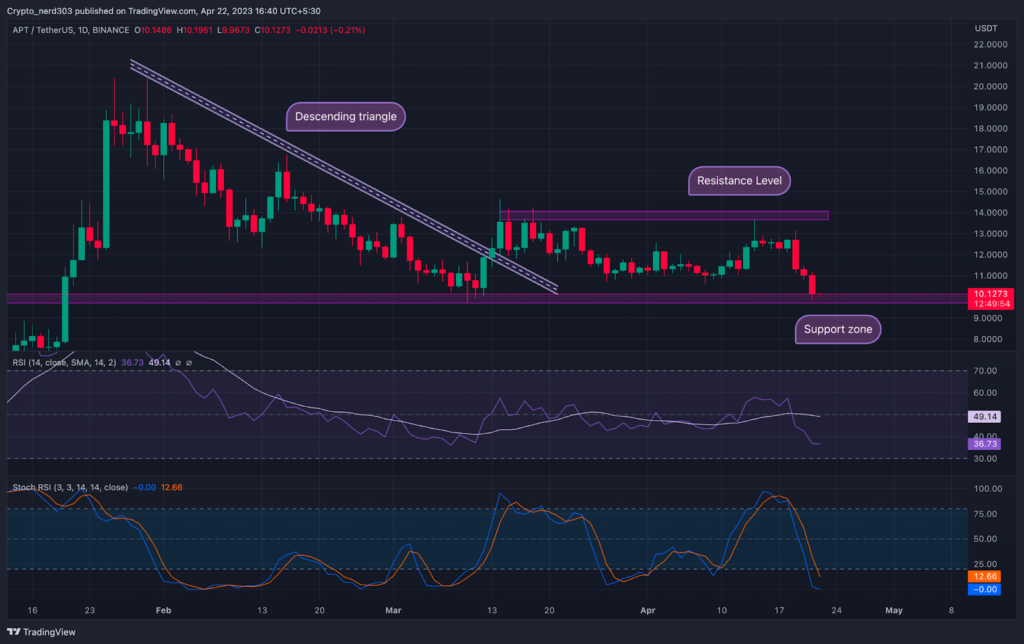
Recently, after being rejected by the buyers at $20.00 the price started trading within a descending triangle. Reaching the support at $10.00 the price made a breakout through the triangle. Often the breakout of a descending triangle results in a bullish rally which goes up to the peak of the previous trend. Though the buyers were disappointed this time as the price after making a breakout with a retest started trading sideways.
The RSI line is moving above the oversold level at present and the SMA is providing resistance to the price of APT near the median line. The current value of RSI is at 36.73 points; the 14 SMA line is trending above the median line around 49.14 points. The RSI curve is suggesting a bullish reversal however 14 SMA can provide significant resistance to it.
The stochastic RSI is trading near extreme oversold levels. The % D line is at 12.65 points and the %K line is at -0.00 points. The Stochastic line is also making a bullish W pattern near demand levels.
Conclusion
APT price is presenting an overall bullish perspective on the daily timeframe whereas the Ocilators are also providing a bullish indication bullish. Investors may prefer to wait for either a bearish breakout or a bullish reversal before making any decision as the price is still trading at a critical phase.
Technical levels –
Support –$10.0000
Resistance – $13.000
Disclaimer
The views and opinions stated by the author, or any people named in this article, are for informational purposes only, and they do not establish financial, investment, or other advice. Investing in or trading crypto assets comes with a risk of financial loss.

Andrew is a blockchain developer who developed his interest in cryptocurrencies while pursuing his post-graduation major in blockchain development. He is a keen observer of details and shares his passion for writing, along with coding. His backend knowledge about blockchain helps him give a unique perspective to his writing skills, and a reliable craft at explaining the concepts such as blockchain programming, languages and token minting. He also frequently shares technical details and performance indicators of ICOs and IDOs.


