
 Home
Home News
News
- FET price is currently trading at $0.3982 seeing a drop of 30% in 24-hour trading volume.
- FET price observed a sharp decline of 0.06% in the last 24 hours.
The major trend for the FET price is bullish for the last couple of months. The price has seen a major increase where it tripled its value within the last few months. Investors’ sentiments regarding the price of FET are optimistic as the price is finding constant buyer support.
After a short bearish reversal in accordance with our analyst’s prediction, the price at present is giving positive indications for a bullish reversal.
At present, the price is trading at $0.337 observing a slight decline in the last couple of days. The price is giving bullish indications. The price has been giving constant respect to its 100 EMA and the oscillators observing the previous price action. At percent, the price is trading near its demand zone near the 100 EMA while the RSI and stochastic are trading in the demand zone.
Previous Analysis Chart (Daily Timeframe )
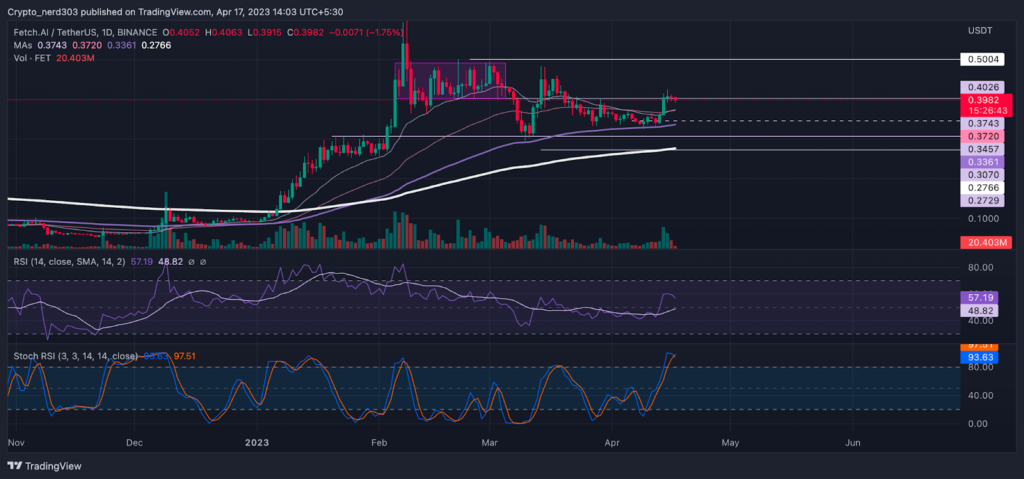
In the previous analysis, It was predicted that the price can take a bearish reversal of 16% after taking rejection from the $0.4400 price point. The analysis was given as the RSI and Stochastic RSI lines were taking a reversal near the overbought levels and the price was making a bearish curve by taking resistance from $0.4400. The analysis was proven correct when the price after taking rejection made a correction of 25%.
The overall market sentiments are trading near neutral levels at 53 points. The sentiment index is observing a major decline since the last week when the market was trading at around 68 points, As per the greed and fear index provided by the Alternative(dot)me platform.
A major impact of sellers is observed in most of the cryptocurrency exchange platforms where they are they are dominating the price action by 50 – 63% according to the Coinglass platform a cryptocurrency exchange platform.
Technical Analysis of FET Price
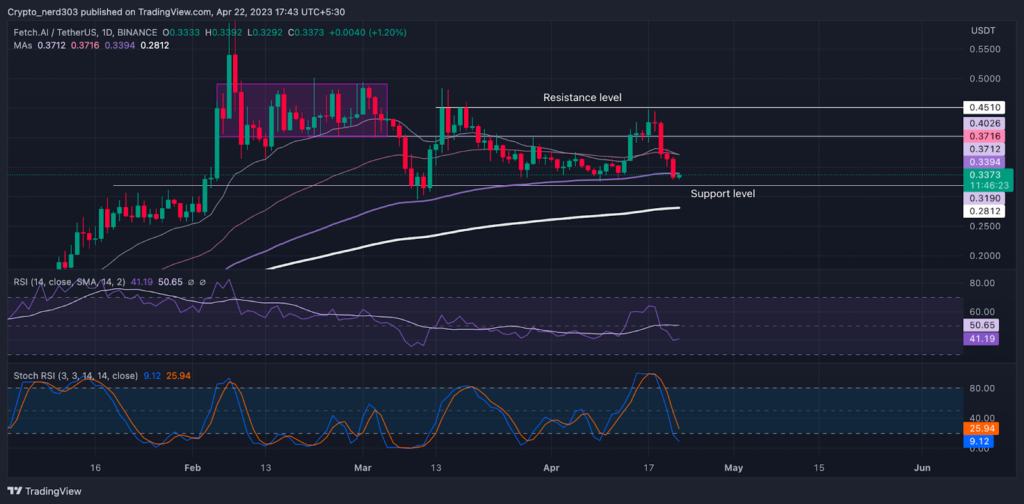
The RSI line is currently taking a reversal near the oversold levels. The present value of the RSI line is 41.19 points and the 14 SMA is providing resistance to it at 50.65 points. The upward curve of the RSI is indicating a bullish move in near future.
Conclusion
FET price is trading on a bullish trend. According to the analysis, FET price may continue this bullish trend in near future. The oscillators, Stochastic RSI and RSI are also reflecting this by trading near the oversold zone.
Technical levels –
Support -$0.4500
Resistance – $0.3000
Disclaimer
The views and opinions stated by the author, or any people named in this article, are for informational purposes only, and they do not establish financial, investment, or other advice. Investing in or trading crypto assets comes with a risk of financial loss.

Andrew is a blockchain developer who developed his interest in cryptocurrencies while pursuing his post-graduation major in blockchain development. He is a keen observer of details and shares his passion for writing, along with coding. His backend knowledge about blockchain helps him give a unique perspective to his writing skills, and a reliable craft at explaining the concepts such as blockchain programming, languages and token minting. He also frequently shares technical details and performance indicators of ICOs and IDOs.


