
 Home
Home News
News
- 1 OKB price fell with BTC tumbling down, marking a down of 9%.
- 2 The coin broke the support near $50.00.
OKB price marked a breakdown, as the primary crypto, Bitcoin slipped from the $30,000 threshold. The price fell marking a dip by 9% in a single trading session matching its price action with BTC. The coin marked an uptrend, when BTC rose to $30,000 milestone. The OKB is influenced by the market trends as typically happens when BTC heads south. The altcoins tend to shed when BTC falls from higher levels and retest the supports below. The present fall can face correction once the market is over the dip.
The Monoscope
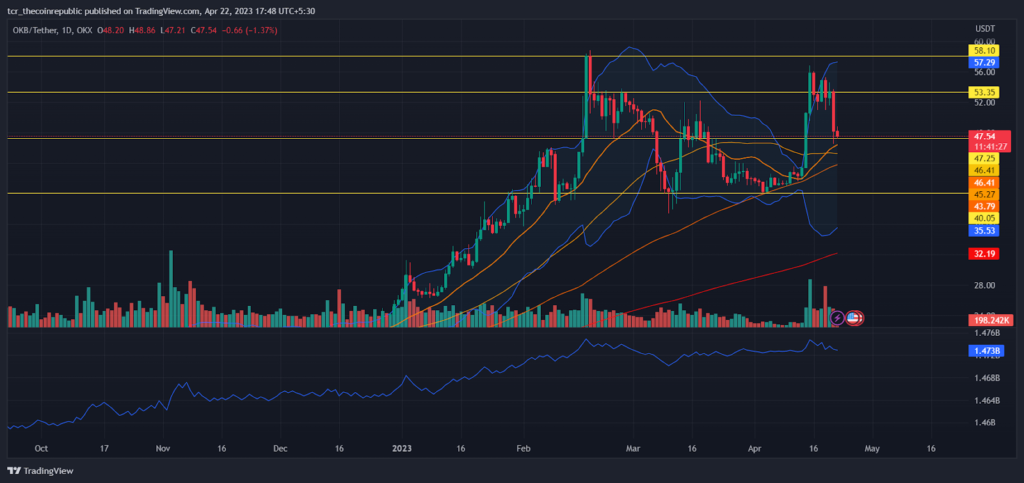
OKB price falls following the dip in the BTC. The trading volume reflected the increasing selling pressure due to falling prices. The EMA ribbon floats below the current price action but if the fall continues, the price can anytime recapture the ribbon, marking a bearish momentum. The Bollinger Bands diverge wide to display present volatile movement in OKB price. The downtrend in OBV supports the bearish trends in the price. The price can look for support near $47.25.
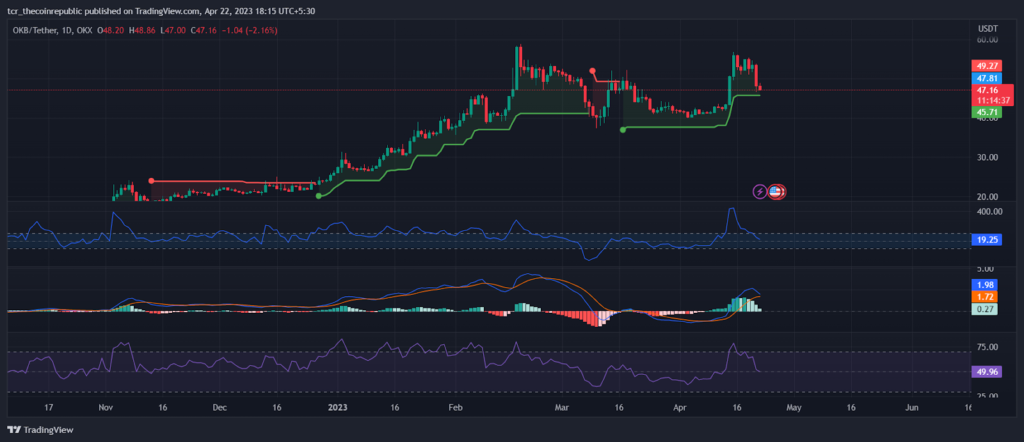
The drop in OKB price makes the bullish pattern formed in the Super Trends go sideways, and can even attempt to breach it. The CCI drops to half line, suggesting a contracting difference between the present OKB price and its historical prices. The MACD nears a convergence and records descending buyer bars to suggest decline in purchases. The RSI drops to 50-range matching the MACD and reflecting descending buyer interest.
The Microscope
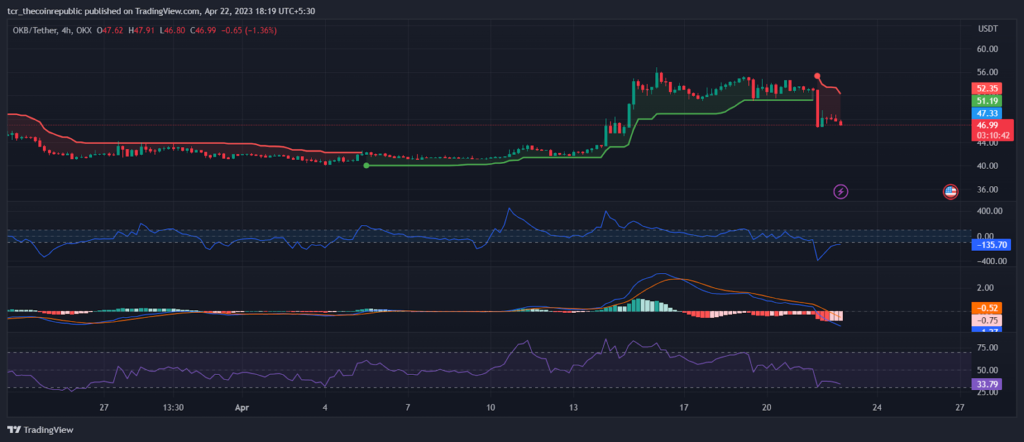
The four hour time frame shows OKB setting a bearish trend, breaking a prolonged bullish swing in the Super Trends. The CCI falls in the negative zone reflecting a pessimistic difference between historical prices and OKB price at press time. The MACD widens the negative cross and records increased seller interaction. The RSI falls close to oversold range, indicating surging seller interest in the falling OKB price.
Conclusion
OKB price took the down road when BTC dipped from the $30,000 milestone. The influenced price action, sets a bearish tone for OKB. The falling price can take support at $47.25 and plan for a reversal. The massive drop of 9% in the coin has attempted to breach the bullish momentum in the market. The price can retrace once the market recovers.
Technical levels
Support levels: $47.25 and $40.05
Resistance levels: $53.35 and $58.10
Disclaimer
The views and opinions stated by the author, or any people named in this article, are for informational purposes only and do not establish financial, investment, or other advice. Investing in or trading crypto assets comes with a risk of financial loss.

Andrew is a blockchain developer who developed his interest in cryptocurrencies while pursuing his post-graduation major in blockchain development. He is a keen observer of details and shares his passion for writing, along with coding. His backend knowledge about blockchain helps him give a unique perspective to his writing skills, and a reliable craft at explaining the concepts such as blockchain programming, languages and token minting. He also frequently shares technical details and performance indicators of ICOs and IDOs.


