
 Home
Home News
News
- The XLM price is currently trading at $0.928 while seeing a change of 8.21% in 24-hour trading volume.
- The XLM price is observing a decline of 3.24% in the last 24 hours.
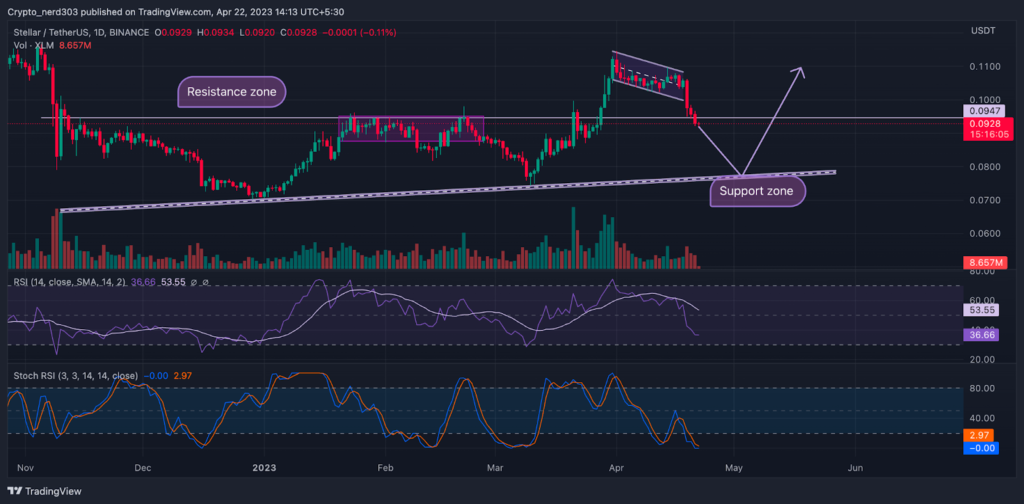
XLM’s price recently broke its bullish expectations by giving a bearish breakout to the descending flag pattern. The descending flag pattern is often observed at the beginning of a bull trend, in which the price after making a bullish rally gives a small bearish correction before making another breakout. However in this case the price instead of making a bullish breakout took a bearish turn.
Facing rejection from the $0.1100 price of XLM made an extremely bearish move. The price broke all of its critical support levels at 100 and 200 EMA. Presently, the price is trading at a 13% depreciation in its value. According to the price action, this bearish trend may continue in near future.
Although oscillators and SMA are presenting a contradicting view. Where the price is giving significant bearish indications with EMA’s support. The oscillators are trading near the demand zone signaling a reversal and the 100 and 200 Moving Average is providing critical support to the price at $0.0928.
At present the total market cap for XLM is 2.49B, ranking at 28th position by the market cap in the crypto-verse.
Technical Analysis ( 1 Day Timeframe )
The XLM price recently made a death cross between the major EMA’s. Near the end of April Steller’s price made a sharp reversal from $0.110 and crossed below all the major key averages with strength. Presently, the 20 EMA is giving a bearish crossover to 200 EMA and the price is trading just below 100 EMA taking resistance.
On contrary, the Moving averages and Ocilators are moving against the EMA’s. The 200 and 100 Moving averages are currently providing support to $0.0982 making a convergence between them.
The RSI line is currently moving above the oversold level; the SMA is providing resistance to it at the median line. The current RSI value is 36.66 points and the 14 SMA line is trending above the median line around 53.55 points. The RSI curve is suggesting a bullish reversal.
The stochastic RSI is trading near extreme oversold levels. The % D line is at 2.97 points and the %K line is at -0.00 points. The Stochastic line is also making a bullish W pattern near demand levels.
Conclusion
XLM price is presenting a contradictory situation where on one hand the price action and EMA’s are giving bearish signals and SMA with bullish. The investors may prefer to wait for either a bearish breakout between SMA or a bullish reversal.
Technical levels –
Support –$0.0800
Resistance – $0.1100
Disclaimer
The views and opinions stated by the author, or any people named in this article, are for informational purposes only, and they do not establish financial, investment, or other advice. Investing in or trading crypto assets comes with a risk of financial loss.

Andrew is a blockchain developer who developed his interest in cryptocurrencies while pursuing his post-graduation major in blockchain development. He is a keen observer of details and shares his passion for writing, along with coding. His backend knowledge about blockchain helps him give a unique perspective to his writing skills, and a reliable craft at explaining the concepts such as blockchain programming, languages and token minting. He also frequently shares technical details and performance indicators of ICOs and IDOs.


