
 Home
Home News
News
- BCH’s price is currently trading at $131.00 while seeing a change of 13.30% in 24-hour trading volume.
- Bitcoin Cash is up by 0.11% in the last 24 hours.
The price of BCH at present is seeing a decline of 15% within the last couple of days. As predicted in the previous analysis the price after taking rejection from the 100 EMA observed a decline of 9%. The sentiments of the investors have been trading near the fear zone though that might change if the price takes a reversal from the trendline.

If the price gains investors favors from the trend line it can rally up 15% within a week. The BCH price has been respecting its trendline for the previous 6 months. Though as the present price is facing critical resistance from the 200 EMA despite making several attempts to breach the current resistance points it has not been able to accomplish the feat.

BCH price is facing severe resistance from the 200 EMA
In the previous analysis, it was estimated If the price faces rejection from the current level it can make a downturn of 8% further within bears’ influence. As it was receiving a severe rejection from its long-term resistance 200 EMA near the price of $135.0.
As per the Greed and Fear index provided by the Alternative(dot)me, the market sentiments are slowly moving towards the greed zone from neutral levels. At present the sentiments are trading at 64 points seeing a significant increase of 14 points within the last week.
At present buyers and sellers are struggling for dominance across most of the major cryptocurrency platforms. Where the sellers are controlling some of the platforms by 75% the buyers are attempting to take control by 65% across the remaining platforms.
Technical Analysis ( 1 Day Timeframe )
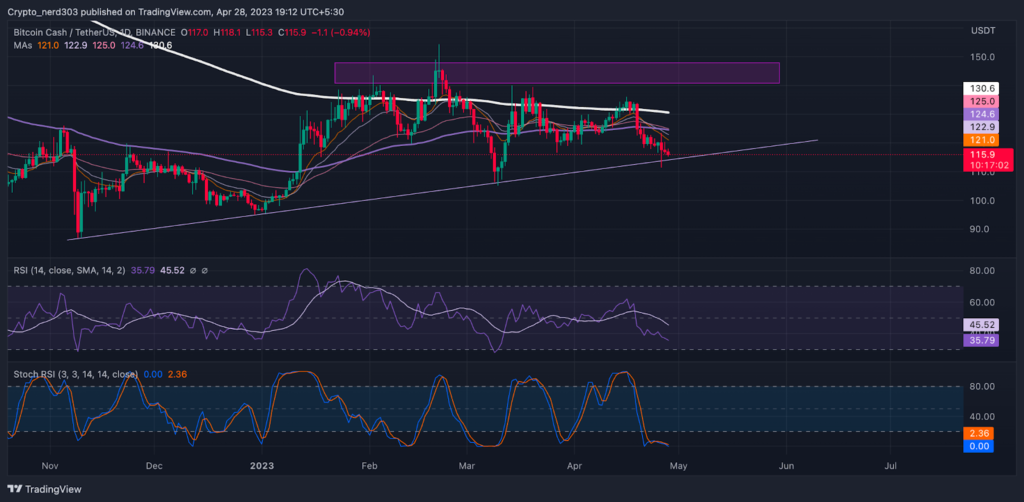
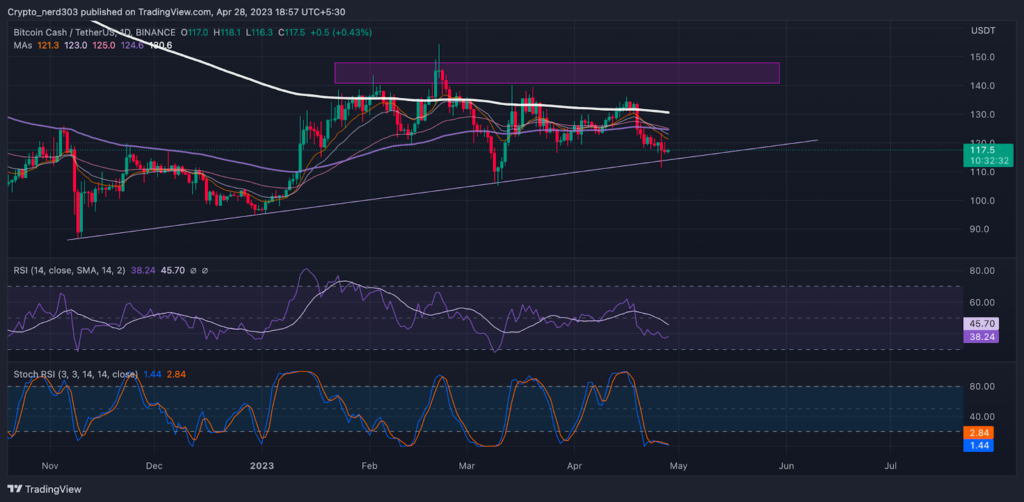
Presently the price is attempting to take a reversal from the trend line at $115. The RSI line is trading just above the overbought level at 35.79 points. The 14 SMA is providing resistance to it at 45.52 points.
The stochastic RSI is trading at extreme oversold levels below 30 points. The current value of stochastic RSI is 2.36 points. The %K line is near 0.00 points suggesting a bullish reversal.
Conclusion
The price of Bitcoin Cash is trading near the demand zone. Its recent support zone around $110.0 where the next support level for it is at $100.0. The resistance point for the price of BCH is near $130.0 and its major resistance is at $140.0.
Technical levels –
Support –$110.0 and $100.0
Resistance – $130.0 and $140.0
Disclaimer
The views and opinions stated by the author, or any people named in this article, are for informational purposes only, and they do not establish financial, investment, or other advice. Investing in or trading crypto assets comes with a risk of financial loss.

Nancy J. Allen is a crypto enthusiast, with a major in macroeconomics and minor in business statistics. She believes that cryptocurrencies inspire people to be their own banks, and step aside from traditional monetary exchange systems. She is also intrigued by blockchain technology and its functioning. She frequently researches, and posts content on the top altcoins, their theoretical working principles and technical price predictions.


