
 Home
Home News
News
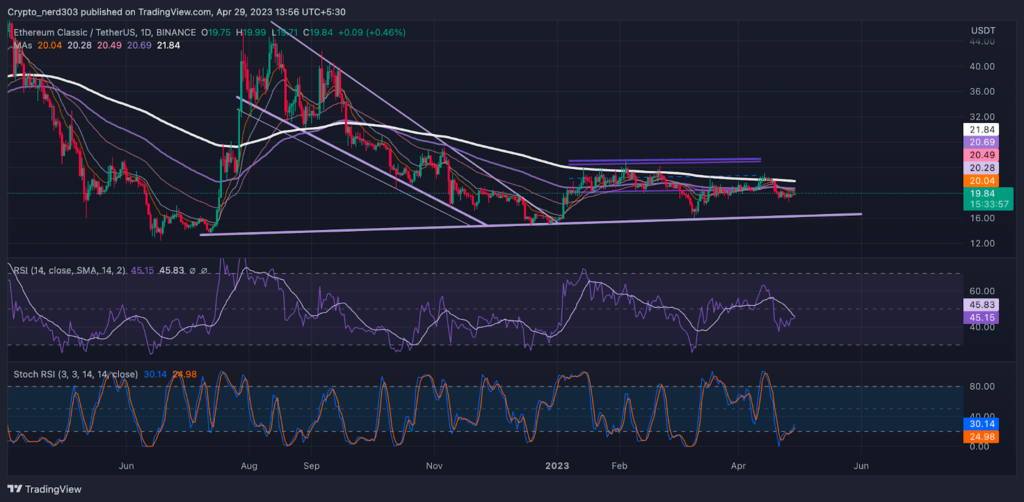
- ETC price is currently trading at $19.84 with an 86% drop in the 24-hour trading volume.
- ETC price is up by 0.78% in the last 24 hours.
- ETC price might see a slight decline in the near future.
The ETC price has been making constant attempts to break above its severe resistance at 200 EMA. Though after its bullish recovery near early January, it has not been able to make a breakout as of yet. Currently, the Investor’s sentiments regarding the ETC price are trading in the fear zone. It is making a retest from the convergence of faster-moving averages below 200 EMA. If the price takes a rejection from the current level it may make a downfall of 18%.
At present, the price is recommencing its previous bearish trend as was estimated in the previous analysis. It was forecasted that the price after taking rejection from the 200 EMA can take a correction of 24%. As was predicted the price is trading 14% below its previous resistance point. The ETC price is yet to attain its target and according to the analysis the price may give a further downfall of 10%
ETC Price May Take a Downturn of 14%
Ethereum Classic price is currently favoring the bears. The oscillators RSI and Stochestic RSI are indicating that a bullish rally may occur before the price attains its target. Though RSI is facing resistance from 14 SMA. Both the Exponential Moving average and Simple Moving average are providing grave resistance to the ETC price at the moment. This is an extremely bearish indication because many Investors respect these averages and the pointing of these averages in the same direction strengthens the prediction.
Technical Analysis of ETC Price

The RSI line is currently trading below the median line taking resistance from 14 SMA. The present value of the RSI line is 45.15 points and the 14 SMA is providing resistance to it around 45.83 points. The price of ETC is also facing resistance from major EMA’s which suggests that the price can take a bearish turn.
The stochastic RSI is taking a reversal from the oversold zone. Presently %K line is crossing over the %D line near 24 points. Stochastic RSI has recently crossed above the 30 RSI points suggesting a bullish turn of trend.
Conclusion
The price of ETC is at present facing severe resistance from major EMA and MA levels. The RSI line is taking resistance from 14 SMA though Stochestic RSI is bullish. The majority of Technical Indicators are giving bearish indications.
Technical levels
Support – $18.00 and $16.00
Resistance – $22.00 and $24.00
Disclaimer
The views and opinions stated by the author, or any people named in this article, are for informational purposes only, and they do not establish financial, investment, or other advice. Investing in or trading crypto assets comes with a risk of financial loss.

Andrew is a blockchain developer who developed his interest in cryptocurrencies while pursuing his post-graduation major in blockchain development. He is a keen observer of details and shares his passion for writing, along with coding. His backend knowledge about blockchain helps him give a unique perspective to his writing skills, and a reliable craft at explaining the concepts such as blockchain programming, languages and token minting. He also frequently shares technical details and performance indicators of ICOs and IDOs.


