
 Home
Home News
News
- 1 Sandbox Price is stuck in a narrow range and trying to defend $0.5000 support.
- 2 SAND price is near to the demand zone and downside seems limited.
- 3 Sandbox Price Prediction suggests a rise in the long term.
Sandbox price fell 15% in the previous week and returns back to the lower range of consolidation. SAND price got rejected from the $0.7000 hurdle and formed a bearish pattern. However, the price near to the demand zone and bears are lacking the downside momentum. It shows that responsive buyers are getting active and downside seems to be limited.
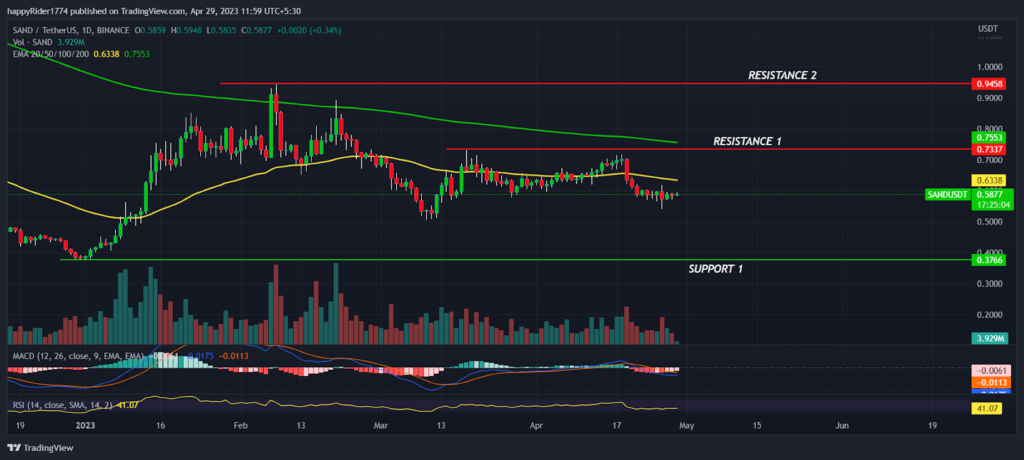
Sandbox Price is trading below the 200 day EMA showcase positional trend is still in downward direction. However, the EMA is sloping sideways indicates price might remain in consolidation.
Sandbox Price is trading at $0.5877 with an intraday decline of -0.34%. The 24 hour volume to market cap ratio is at 0.0613. The pair of SAND/BTC is trading at 0.00002005 with an intraday rise of 0.35%. The chart structure of the SAND with BTC pair is in strong downtrend and slipping down by forming lower low swings. Whereas, the SAND/USDT pair is quite stable and trading in a narrow range.
In the month of February, Sandbox Price tried multiple times to break the $1.00 hurdle but got rejected. Later, prices witnessed profit booking and began to decline. Slow and steady, it dropped below the 50 day EMA which turned the short term trend in a downward direction and invited further decline.
Will Sandbox Price reach $1.00 before 2023 end?
Sandbox price downfall took halt near the $0.5000 and formed a bullish hammer candle. It showed the signs of the bullish trend reversal and prices recovered 40% approx from the support.
However, SAND price failed to give the follow up momentum and got stuck into the narrow range consolidation. It showed the signs of the base formation. If the buyers succeed to break the $0.7000 hurdle then the probability of reaching $1.00 will substantially increase. On the other hand, if the price dropped $0.5000 then bears will try to drag it down towards the yearly lows. The technical analysis suggests, Sandbox Price is near the demand zone and till price holds $0.5000 the downside seems limited.
SAND price lacked direction
SAND price has not performed well in the past few weeks and is forming a Doji candle on a weekly time frame. It shows price lacked direction and more consolidation is possible. If the overall market sentiment improves then it might positively impact the prices of Altcoins.
The technical indicators like MACD had generated a negative crossover indicates mild bearishness. The RSI at 41 sloping sideways denotes prices likely to consolidate and may try to reach the neutral territory.
Conclusion
Sandbox price fell 15% on a previous week and took support near to its demand zone. It shows responsive buyers are still active at lower levels and prices seem to be bottomed out. Technical analysis suggests, Till SAND price holds $0.5000 support, long term investors are safe and downside is limited.
Technical levels
Resistance levels : $0.7337 and $0.9458
Support levels : $0.5000 and $0.3766
Disclaimer
The views and opinions stated by the author, or any people named in this article, are for informational purposes only. They do not establish financial, investment, or other advice. Investing in or trading crypto assets comes with a risk of financial loss.

Andrew is a blockchain developer who developed his interest in cryptocurrencies while pursuing his post-graduation major in blockchain development. He is a keen observer of details and shares his passion for writing, along with coding. His backend knowledge about blockchain helps him give a unique perspective to his writing skills, and a reliable craft at explaining the concepts such as blockchain programming, languages and token minting. He also frequently shares technical details and performance indicators of ICOs and IDOs.


