
 Home
Home News
News
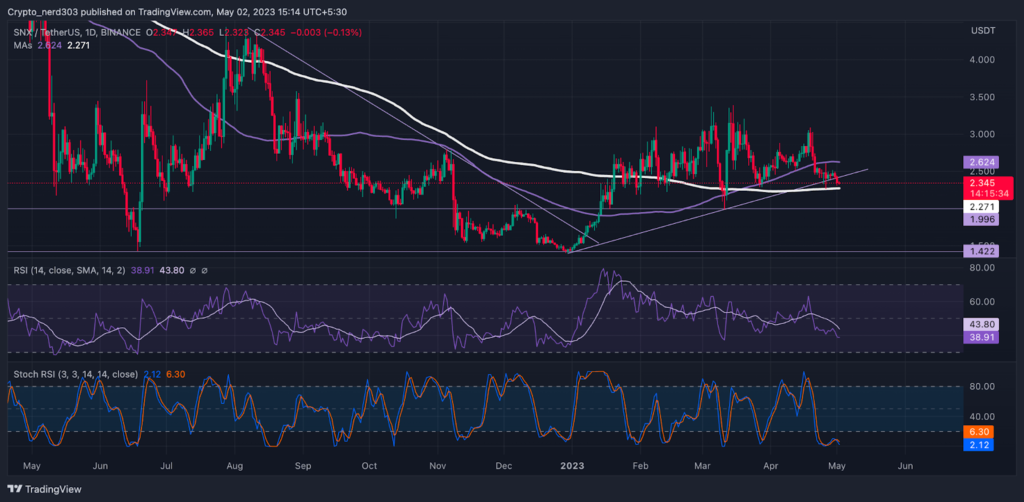
- SNX’s price is currently trading at $2.345 while recording a fall of 20.65% in 24-hour trading volume.
- SNX price declined by 2.56% in the last 24 hours.
The price of SNX is currently trading near a critical support level at present. From the past few weeks, SNX’s price has been making continuous efforts to break above its resistance level near $3.000 however it has not been able to breach above it as of yet. After taking rejection from its previous resistance zone the price is facing a decline of 25% within the last few weeks. The SNX price is giving more importance to Moving Average than Exponential Moving Average.
At present, the technical indicators and price action is favoring the bulls on the Daily timeframe. If the price gains buyers support from recent levels it can continue moving on its bull trend. The Stochastic RSI is trading near the demand zone and the RSI line is trading near its previous support zone.
SNX Price is Taking support from the 200 Moving Average
Previously, in early January, SNX’s price broke out of its bear trend with strength gaining more than 95% of its value in the process. After making a bullish rally, the price took resistance from $4.200 and made a sharp fall of 38%.
The price gained buyers’ support near the 100 EMA. After this, it started trading on a bull trend gaining constant buyers from the trend line for the next few months.
Technical Analysis (1-Day Timeframe )
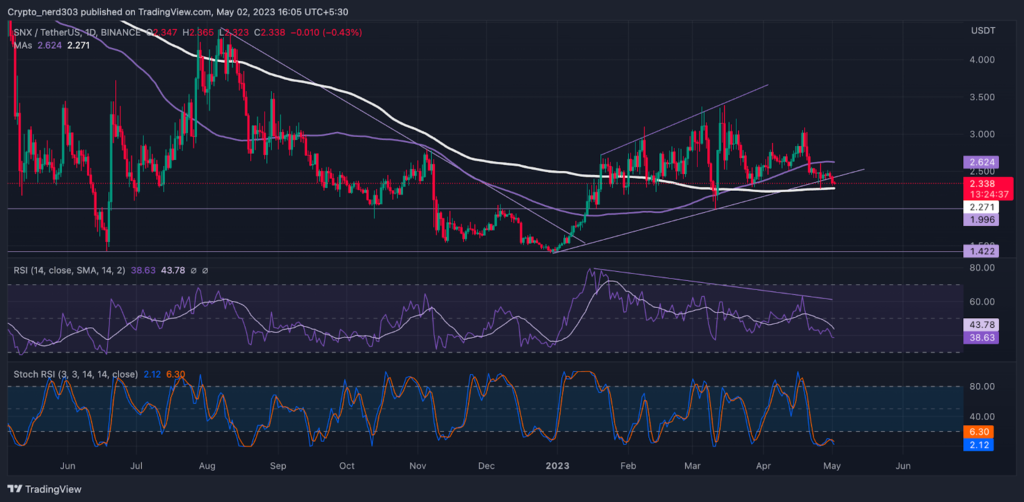
SNX price is currently taking support from the 200-day Moving average changing its trend in favor of the bulls. The price recently crossed below the 100-day Moving average near the end of April. Observing the historical price action the SNX price is respecting its Simple Moving Average more than the Exponential Moving Average.
The RSI line is trading below the 14 SMA and median line on the daily timeframe. The RSI value at present is 38.95 points. The value of 14 SMA is 43.81 points. The RSI line seems to be providing a slight diversion at the current moment.
The stochastic is trading near the oversold levels. The %K line is trading below the %D line on the daily timeframe. The current value of Stochastic RSI is 2.12 points.
Conclusion
According to the analysis the price is currently trading near a crucial support level above 200 MA. If it gains buyers’ support from this level the price can make a bullish upturn of 55% in a couple of weeks.
Technical levels –
Support -$2.271
Resistance – $3.500 and $3.000
Disclaimer
The views and opinions stated by the author, or any people named in this article, are for informational purposes only, and they do not establish financial, investment, or other advice. Investing in or trading crypto assets comes with a risk of financial loss.

Andrew is a blockchain developer who developed his interest in cryptocurrencies while pursuing his post-graduation major in blockchain development. He is a keen observer of details and shares his passion for writing, along with coding. His backend knowledge about blockchain helps him give a unique perspective to his writing skills, and a reliable craft at explaining the concepts such as blockchain programming, languages and token minting. He also frequently shares technical details and performance indicators of ICOs and IDOs.


