
 Home
Home News
News
- 1 The AAVE price is currently trading at $71.3 near the demand zone.
- 2 The AAVE price has been observing an increase of 5.01% in the last 24 hours.
The price of AAVE is preparing to make a bullish reversal at present from its recent support level near $65.5 level. The price is at the moment trading near an important support level. The price has taken support multiple times within the past few months. It is predicted to see an increase of 14% if it gains the investor’s support at the recent level. The making of an engulfing candle near the support zone is indicating that the AAVE price may continue to make a bullish recovery.
At present the majority of technical indicators are favoring the bulls. The price is facing critical resistance from both major key Exponential Moving averages and Moving averages. These indicators are respected by small and major players in the market. Price has been making continuous efforts over the past few months to cross above the critical resistance levels without success after its recent fall in early March.
The RSI line is taking resistance from the median line whereas the Stochastic RSI has already crossed above it.
AAVE Price taking a reversal from the demand zone (Daily Timeframe)
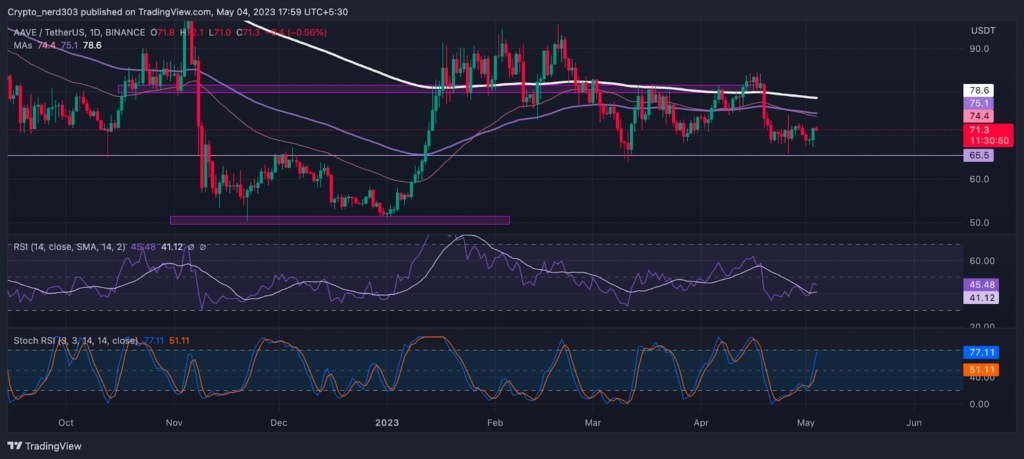
Since failing to sustain above the 200 EMA level the price has been making constant attempts to break above it and resume its bullish trend. At present, the price of AAVE is consolidating within a broad consolidation bread range below the key Moving Averages. It can be estimated that the price is currently in the accumulation phase looking at the bigger picture,
Technical Analysis ( 1 Day Timeframe )

The RSI line has recently taken a reversal from the oversold levels where it crossed above the 14 SMA. The present RSI value is 45.48 and the value of 14 SMA is 41.72 points. The RSI line is suggesting that it can make a bullish move with the price. The probability of a bullish reversal is weak because of the multiple resistance levels the price is facing.
In stochastic RSI The %K line has already crossed above the median line and the %D line is following it closely. Presently the value of the Stochastic RSI has crossed above 77.11 points on the 1-Day chart.
Conclusion
As per the analysis, The price is specifying a bullish reversal in the upcoming days. Its most recent resistance point is around $70.00 whereas the critical resistance for AAVE is at $80.00. The oscillators are giving bullish indications
Technical levels –
Support – $65.00
Resistance – $80.00and $70.00
Disclaimer
The views and opinions stated by the author, or any people named in this article, are for informational purposes only, and they do not establish financial, investment, or other advice. Investing in or trading crypto assets comes with a risk of financial loss.

Andrew is a blockchain developer who developed his interest in cryptocurrencies while pursuing his post-graduation major in blockchain development. He is a keen observer of details and shares his passion for writing, along with coding. His backend knowledge about blockchain helps him give a unique perspective to his writing skills, and a reliable craft at explaining the concepts such as blockchain programming, languages and token minting. He also frequently shares technical details and performance indicators of ICOs and IDOs.


