
 Home
Home News
News
- 1 SOL coin is still in trouble and consolidating in a narrow range.
- 2 Buyers are trying to accumulate but facing rejection.
The Solana Price Prediction stays below the 200-day EMA, which was the primary concern for investors waiting to make fresh positions. Moreover, the immediate hurdle of $25 is the mark that has acted as the supply range for the past weeks. The coin is trading in a narrow range of $16 – $22 and hovering within it. However, sellers continue to make short positions and a strong grip near $25.Based on price action, buyers are looking weak, and momentum is shifting toward bears.
SOL forms an ascending triangle pattern but cannot register a breakout due to lower volumes. The Bollinger band is squeezed, signalling that a big move is ready to be seen in the upcoming days. Moreover, the trend is still negative because of the short candles, which shows the weakness on the chart.
When writing, the Solana coin is trading at $21.77 with a drop of 1.96%, showing mild bearish cues. The pair of SOL/BTC is at 0.0007470 satoshis. Moreover, the trading volume showed a decline of 35%.
Daily Chart Shows Bears Tightening Grip
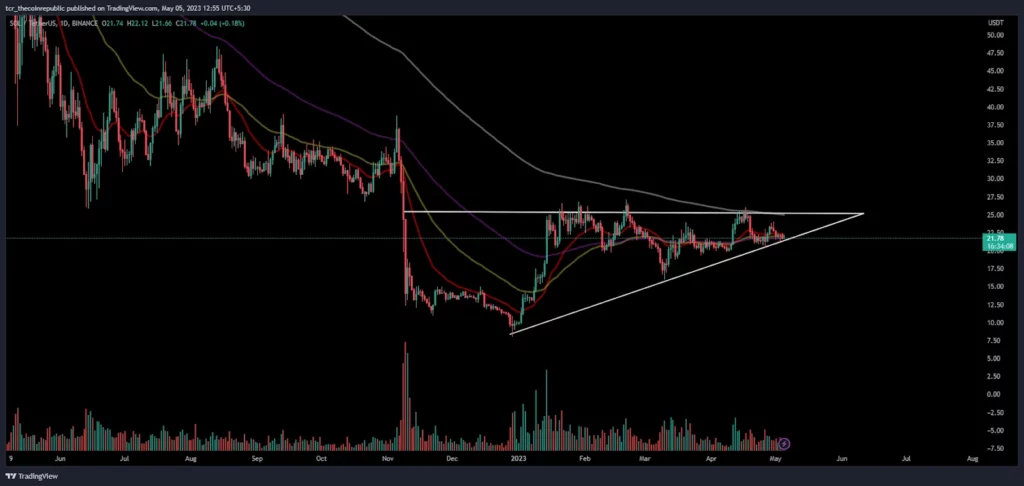
On the daily chart, SOL, Solana Price Prediction reflects slow moves with dropdowns in trading volumes on an intraday basis. Furthermore, a price below $25 signals that bears are active, and buyers face trouble escaping above that. Conversely, the price supports the lower trendline of the ascending triangle pattern and fetching neutrality. This gradual move makes SOL claim 20-day EMA and trade in a small range. From the last months, the SOL coin does not show any massive moves and stays in a particular range forming a lower lows sequence.
The Fib levels indicate that the SOL price is above the 38.2% level above $19.70 but below the 50% level below $24.These levels tell that the coin is stuck in a biassed range, and the trading trajectory is very narrow. However, bulls and bears are still showing aggression and willing to take charge to form trending moves but cannot register.
What Traditional Indicator Says?
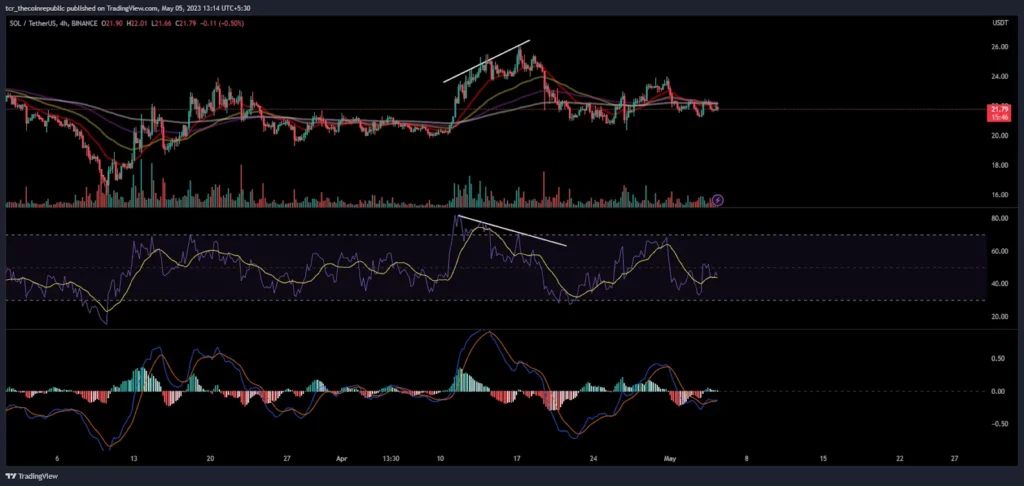
On the 4-hour chart, the SOL coin indicates negative cues based on RSI. In the last week, the negative divergence on the curve shows the price when forming higher highs, but RSI reflects lower highs which show that the move is fake, resulting in a downtrend in price.
The RSI and MACD indicator indicates neutrality on charts and does not signal any massive move in the upcoming days.
Conclusion:
Solana coin (Solana Price Prediction) is stuck in a biased range. The recent dip in the trading volume suggests that investors are not taking much interest because of the consolidating moves in the past few days.
Technical levels;
Support Levels: $16
Resistance Levels:$25
Disclaimer
The views and opinions stated by the author, or any people named in this article about Solana Price Prediction, are for informational purposes only and do not establish financial, investment, or other advice. Investing in or trading crypto assets comes with a risk of financial loss.

Nancy J. Allen is a crypto enthusiast, with a major in macroeconomics and minor in business statistics. She believes that cryptocurrencies inspire people to be their own banks, and step aside from traditional monetary exchange systems. She is also intrigued by blockchain technology and its functioning. She frequently researches, and posts content on the top altcoins, their theoretical working principles and technical price predictions.


