
 Home
Home News
News

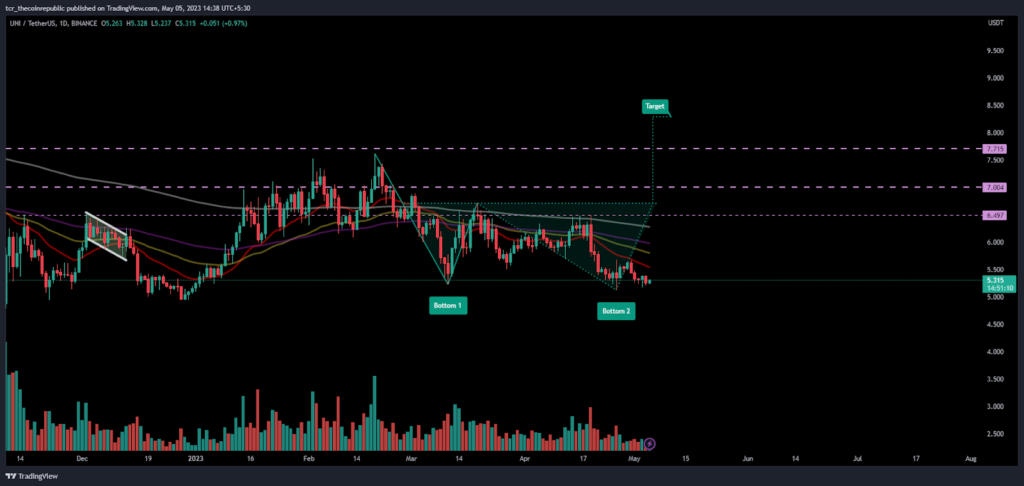
- 1 UNI token is near its support mark and tries to pause the selling pressure.
- 2 Bulls are trying to accumulate price from the demand zone.
Uniswap token is struggling near its demand zone near $5.000, buyers persist to hold the price near support levels. UNI token slips below the significant moving averages and try to claim 20 day EMA to attain neutrality. Moreover, the chart shows a double bottom pattern which indicates that a bounce from the demand zone is awaiting now. The neckline of the pattern is at $6.80, above that pattern activates and bulls may show strength. However, the token is folding the gains in the last days and sellers show their aggressive muscles. The price action is showing that the token is unable to hold at any support mark and broke the immediate support levels.

When writing. UNI token is trading at $5.311 with a slight dip of 0.60%. Moreover, the pair of UNI/BTC is at 0.0001825 satoshis. The intraday trading volume tanks by 16.50% which shows lower interest of investors.

Uniswap token price is holding the breath near the support mark of $5.000 and trying to pullback and meet 20 day EMA. If token maintain to stay in the range, then buyers will accumulate in the upcoming days and raise price to fetch the neckline near $6.50
Daily Charts Shows Selling pressure
On the daily chart. UNI token is dragging the trend and meets the strong support mark of $5.00. Bulls are trying to hold the pressure and accumulate gradually. The aggressive sellers continue to make short positions and try to break the price below the support mark. The price action shows that the Bollinger band is squeezed now and buyers are willing to take advantage of that in the form of bounceback. The lower highs and lower lows sequence is shown on the chart with lower volumes.
As per the Fib levels, UNI token is trading below the neutrality and struggling to attain 38.2% levels which was placed near $5.90. At now, price slips below the 23.65% level below $5.50. The token is stuck in a narrow range from the last weeks which is a sign of weakness.
What Traditional Indicator Says?
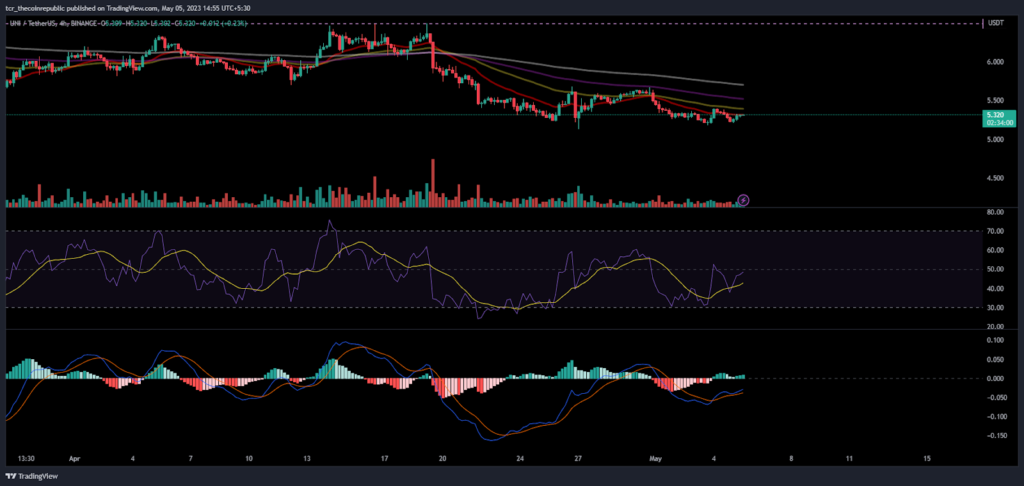
On the 4 hour chart, UNI token shows lack of momentum and mild bearish cues. The bulls are trying to attain gains but selling pressure from bears was very aggressive which bulls were unable to face. The RSI curve is below 50, but attaining a positive crossover which signals that buyers are trying to gain a positive outlook.
Conclusion:
Uniswap token price is forming a double bottom pattern which suggests a bounce in the upcoming sessions and price is at the demand zone.
Technical Levels:
Support Levels: $5.000 and $4.40
Resistance Levels: $6.50 and $7.00
Disclaimer
The views and opinions stated by the author, or any people named in this article, are for informational purposes only and do not establish financial, investment, or other advice. Investing in or trading crypto assets comes with a risk of financial loss.

Nancy J. Allen is a crypto enthusiast, with a major in macroeconomics and minor in business statistics. She believes that cryptocurrencies inspire people to be their own banks, and step aside from traditional monetary exchange systems. She is also intrigued by blockchain technology and its functioning. She frequently researches, and posts content on the top altcoins, their theoretical working principles and technical price predictions.


