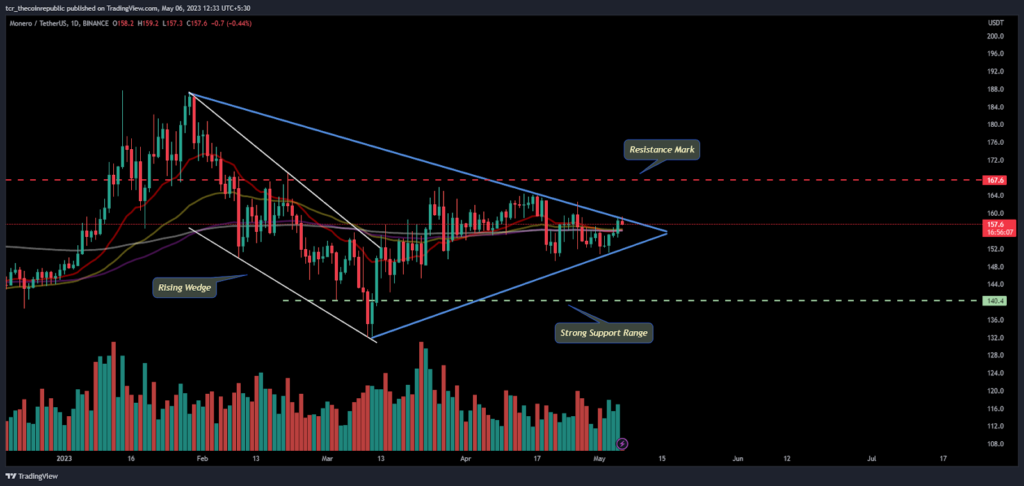
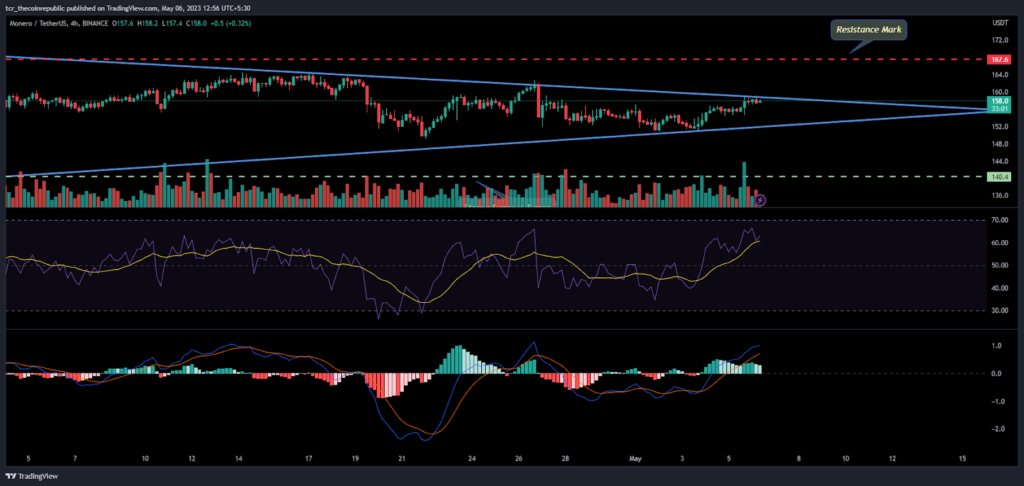
- 1 XMR forms a symmetrical triangle pattern and tries to break the range.
- 2 Buyers are trying to break the consolidation phase.
XMR price was stuck in a consolidation phase and looking to break the neckline of the symmetrical triangle pattern. Buyers continue accumulating the coin price and setting eyes to fetch the immediate hurdle of $165. Moreover, the XMR coin escaped above the significant moving averages in the last session. However, sellers are trying to break the strength of bulls, but still, price action is favoring buyers because the price moves above the 100-day EMA.
XMR coin is also looking to clear the neckline existing near $160, which was the immediate hurdle, if buyers succeed in crossing above it, then momentum will increase. The buyers are trying to gain traction from the last sessions, as trading volume shows a significant upside, and the leading indicators indicate an upside move in the upcoming sessions.
When writing, XMR coin trades at $158.08 with an intraday gain of 1.35%. Moreover, the trading volume shows a massive upside of 30% in the overnight session.
Daily Chart Shows Accumulation in XMR Price

On the daily chart, XMR coin is moving out of the consolidation phase and trying to break the neckline of the symmetrical triangle pattern. Moreover, buying conviction arises from rising wedge pattern as well which indicate a significant upside of 5% from the current price level. Furthermore, XMR coin from the last months maintained the gains and held price above the support mark of $150. Moreover, price is crossing above the middle bollinger band which is a sign of buying strength.
As per the Fib levels, XMR coin is trading above 38.2% level and maintains gains near the neutral mark of $150. Moreover, the parameters are suggesting a bounce from the current levels. XMR coin was gained by 5% in the last 2 trading sessions showing buyers accumulation. If the move continues, then the trajectory suggests the resistance marks of $170.
What Traditional Indicator Says?

On the daily chart, the XMR coin is moving out of the consolidation phase and trying to break the neckline of the symmetrical triangle pattern. Moreover, buying conviction arises from a rising wedge pattern, indicating a significant upside of 5% from the current price level.
Furthermore, XMR coin from the last months maintained the gains and held price above the support mark of $150. Moreover, the price crosses above the middle Bollinger band, a sign of buying strength. As per the Fib levels, XMR coin trades above the 38.2% level and maintains gains near the neutral mark of $150.
Moreover, the parameters suggest a bounce from the current levels. XMR coin gained by 5% in the last two trading sessions showing buyers accumulation. If the move continues, the trajectory suggests the resistance marks of $170.
Conclusion:
XMR coin is willing to break the immediate hurdle and try to move above the barrier of $160.
Technical Levels:
Support Levels:$150
Resistance Levels:$165 and $170
Disclaimer
The views and opinions stated by the author, or any people named in this article, are for informational purposes only and do not establish financial, investment, or other advice. Investing in or trading crypto assets comes with a risk of financial loss.

Andrew is a blockchain developer who developed his interest in cryptocurrencies while pursuing his post-graduation major in blockchain development. He is a keen observer of details and shares his passion for writing, along with coding. His backend knowledge about blockchain helps him give a unique perspective to his writing skills, and a reliable craft at explaining the concepts such as blockchain programming, languages and token minting. He also frequently shares technical details and performance indicators of ICOs and IDOs.


 Home
Home News
News


