
 Home
Home News
News
- 1 The DOGE price is currently trading at $0.074 while seeing a change of 4.49% in 24-hour trading volume.
- 2 The DOGE price is observing a decline of 3.46% in the last 24 hours.
The price of DOGE is currently trading within the bear’s command on the bigger timeframe. In the daily timeframe, the DOGE price is trading sideways not respecting its major EMA levels after its recent breakout through its extended bear trend. The price follows a pattern, the pattern follows a trend with a consolidation followed by a breakout. In the long-term view before the reversal of a trend, the price goes through an accumulation phase.
Presently, the price is trading within a sideways range after breaking out of its bear trend with an extremely bullish candle made near the acquisition of Twitter by Elon Musk. This suggests that the DOGE token is currently under the accumulation phase in the demand zone. It is indicating that in the long term view investor’s sentiments may bow to the side of the bulls.
DOGE Price May Continue the Downtrend (Daily Timeframe)

In the longer timeframe, it can be observed that the DOGE price has been facing constant resistance from the 100 EMA. Even the bullish optimism near the end of October because of Twitter’s acquisition was not sufficient in propelling the price up to break above its resistance level at 100 EMA in a 1-week timeframe.
The price currently has two major support levels through which it can gain buyers’ support and make another attempt to reclaim its previous trend.
Technical Analysis ( 1 Day Timeframe )
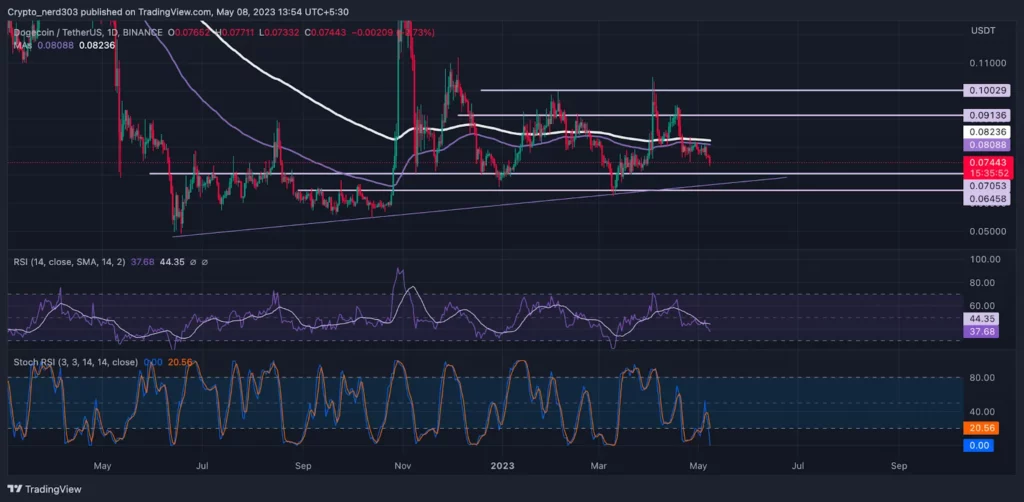
The RSI line is presently trading near the demand zone under a critical downtrend. The RSI line is currently trading near 37.68 points in the oversold level just above the 30 points while taking resistance from the 14 SMA.
Stochastic RSI is steadily approaching near oversold levels on the daily timeframe. The %K has already crossed below 30 points and the %D line is following its lead. The current value of the Stochastic RSI is 20.56 points.
Dogecoin is at present taking rejection from its 200 EMA around the price of $0.082; trading under a downtrend and its next support level are 4% below the current price around the price level of $0.070 and its major support level is 9% below around $0.064.
Conclusion
The price may take a bullish reversal after reaching its major support zone as it is near the trend line. Buyers have been providing constant support to the price for the last 13 months hence the probability of a bullish rebound is more prominent.
Technical levels –
Support – $0.070 and $0.064
Resistance – $0.091 and $0.12
Disclaimer
The views and opinions stated by the author, or any people named in this article, are for informational purposes only, and they do not establish financial, investment, or other advice. Investing in or trading crypto assets comes with a risk of financial loss.

With a background in journalism, Ritika Sharma has worked with many reputed media firms focusing on general news such as politics and crime. She joined The Coin Republic as a reporter for crypto, and found a great passion for cryptocurrency, Web3, NFTs and other digital assets. She spends a lot of time researching and delving deeper into these concepts around the clock, and is a strong advocate for women in STEM.


