
 Home
Home News
News

- 1 The LINK price is currently trading at $6.723 while seeing a change of 35% in 24-hour trading volume.
- 2 The LINK price is observing an increase of 3.10% in the last 24 hours.
The LINK price has been trading within a sideways range for the last few months. The price has recently made an attempt to break above the 200 EMA though did not find any success. The price of LINK at present is giving a 60% on each move in the full trend curve whereas it is giving a move of 40% in the half curve.

The technical indicators favor the bears on the major timeframes. EMA lines are giving critical resistance to the price where the oscillators are already crossing below the median line.

Link price giving a bearish crossover on the (Daily Timeframe)

Presently, the majority of market sentiments have been moving near the Greed zone for the past few months. Currently, its value is 60 points in the index seeing a slight decrease of 3 points within recent days. The decrement in the value was observed within the last week when the market was trading at around 64 points, As per the Greed and Fear Index provided by the Alternative(dot)me.
The majority of bears are currently dominating most of the price action by 50 to 59%. as per Coinglass a crypto information platform.
Technical Analysis ( 1 Day Timeframe )
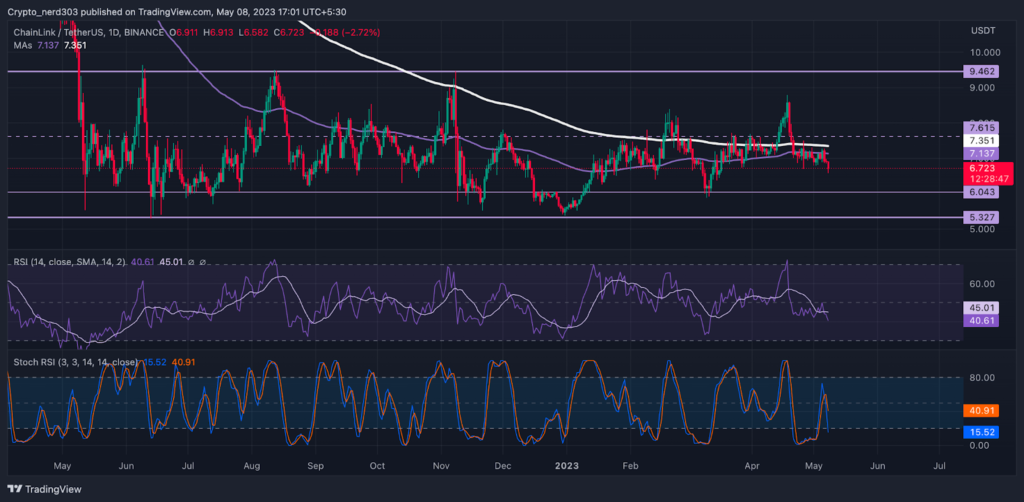
The price of LINK is taking critical resistance from the 200 EMA on the daily timeframe. The current support levels for the LINK price are around $6.000 and its major support level is at $5.000. The resistance point for the price of LINK is near $7.300 and its major resistance is at $9.000.
The RSI line is taking rejection from the median line from 50 points. It has already crossed below the 14 SMA. The value of the RSI line as of now is 40.61 points, while the 14 SMA is giving resistance to it at around 45.01 points.
The stochastic RSI is taking a reversal from 70 points. The %D line has recently crossed below 50 points whereas the %K line is already reaching the oversold levels. The Stochastic RSI is suggesting that the price of LINK may continue to make a bearish move in recent days. The lines have already started moving toward the oversold levels.
Conclusion
According to the analysis, Long-term investors may wait for a breakout before taking any action though the present scenario is ideal for short-term buyers and sellers. The price has been making constant predictable movements for the last few months. Hence it can be expected that it may continue to do so until a breakout is made.
Technical levels –
Support –$5.300 and $7.000
Resistance – $9.000 and $7.615
Disclaimer
The views and opinions stated by the author, or any people named in this article, are for informational purposes only, and they do not establish financial, investment, or other advice. Investing in or trading crypto assets comes with a risk of financial loss.

Nancy J. Allen is a crypto enthusiast, with a major in macroeconomics and minor in business statistics. She believes that cryptocurrencies inspire people to be their own banks, and step aside from traditional monetary exchange systems. She is also intrigued by blockchain technology and its functioning. She frequently researches, and posts content on the top altcoins, their theoretical working principles and technical price predictions.


