
 Home
Home News
News

- 1 TON’s price is currently trading at $1.896 while seeing a change of 4.60% in 24-hour trading volume.
- 2 TON’s price recorded a decline of 0.43% in the last 24 hours.
The TON price is currently observing strong selling pressure. The price is seeing a decline of more than 10% within the last 7 days. It recently made a breakdown through its major support level near the 200 EMA where it gave a first close below it within the last 7 months. This is a major indication of a change in trend. Investors may remain cautious regarding the current trend as the price may experience some volatility before the trend reversal.

The technical indicators are supporting the sellers which indicates that the price of TON may continue to move in a bearish trend. The 50 EMA is crossing below 100 EMA giving a death cross; the RSI line has been making lower high and lower low patterns since early December.

TON Price Makes a Bearish Engulfing Candle
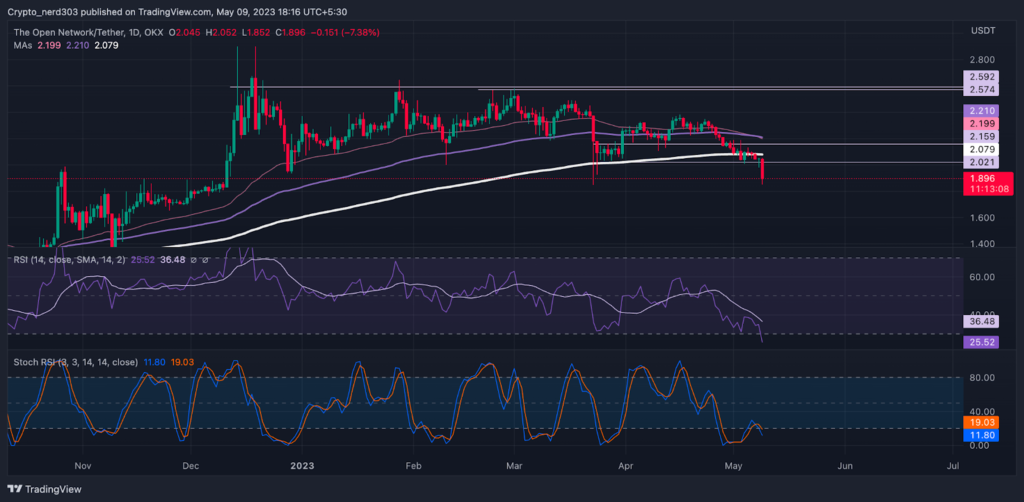
Previously, it was suggested that as the TON price is trading near the neck level of its previous high the price can make a bearish reversal. The Oscillators were also taking a reversal from the overbought levels. The analysis was proven correct when after a rejection the price took a correction of more than 10% breaking below all of its major support levels.
The market sentiments are observing a major decline since the last week, according to the greed and fear index, provided by the Alternative (dot) me platform. The current value of market sentiments in the greed and fear index is 51 points. It is seeing a decrease of 13 points within a short span of time where the sentiments were at 64.
Most of the cryptocurrency exchanges are currently witnessing a fierce struggle between the buyers and sellers where the buyers hold prominence within some exchanges. The buyers are dominating 71% of the market within a few exchanges.
Technical Analysis of the Tron Price

The RSI line is currently trading near the critical oversold levels. The current value of RSI is 25.52 point’s which is trading below the 14 SMA. The current value of 14 SMA is 36.58 points.
The Stochastic RSI is trading near the oversold levels while the %K and %D lines are providing a bearish crossover near 20 points. The current value of stochastic RSI is 11.80 points.
Conclusion
According to the analysis, the price of TRX is giving ominous indications regarding the future trend on the contrary the Ocilators are suggesting a retest before the continuation of bear trend.
Technical levels –
Support -$2.100
Resistance – $1.700
Disclaimer
The views and opinions stated by the author, or any people named in this article, are for informational purposes only, and they do not establish financial, investment, or other advice. Investing in or trading crypto assets comes with a risk of financial loss.

Andrew is a blockchain developer who developed his interest in cryptocurrencies while pursuing his post-graduation major in blockchain development. He is a keen observer of details and shares his passion for writing, along with coding. His backend knowledge about blockchain helps him give a unique perspective to his writing skills, and a reliable craft at explaining the concepts such as blockchain programming, languages and token minting. He also frequently shares technical details and performance indicators of ICOs and IDOs.


