
 Home
Home News
News
- 1 XEC’s price is currently trading at $0.000027 with a drop of 0.35% in 24-hour trading volume.
- 2 The XEC price is up by 4.70% in the last 24 hours.
eCash (XEC) price is currently observing intense selling pressure. The price made multiple attempts to break through a strong barrier over the past few days. However, the sellers overpowered the buyers while maintaining a firm grip on the market. Investors’ sentiments may remain bearish for the near future unless the price projects any promising indications regarding the reversal of the current trend.
XEC Price is Facing a Severe Resistance from the 100 EMA (1-Day Timeframe)
XEC’s price is currently going through a strong selloff phase. The price of XEC declined by 20% within the last two weeks after taking rejection from the 100 EMA. It has been respecting its 100 EMA resistance for the last 12 weeks after taking a critical rejection from 200 EMA. The previous analysis estimated that the price could sharply decline after taking rejection from 100 EMA.
Analysis of Technical Indicators and Price Action

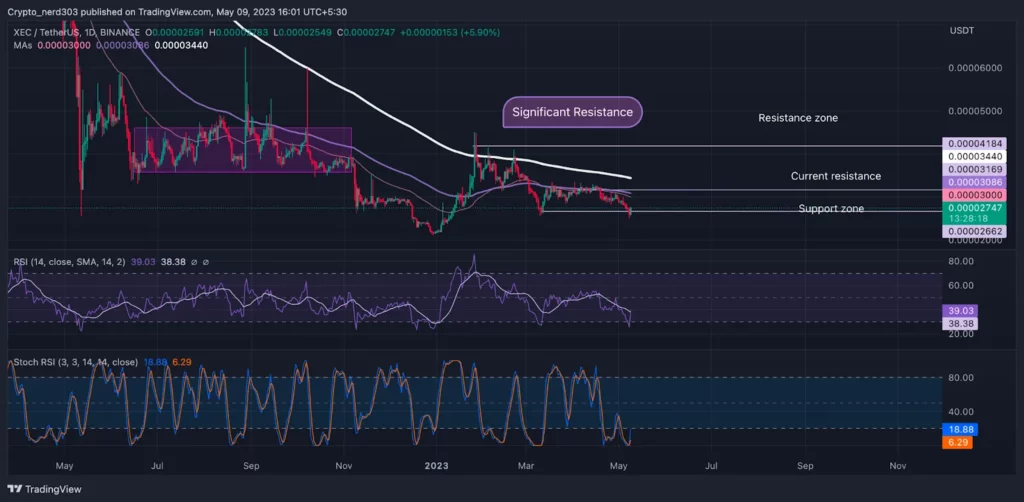
The price indicates a bullish reversal from its recent support zone, making a bullish engulfing candle. As the price is trading under major key EMAs, the probability is that it may continue its bearish trend after retaking its recent resistance level on the daily timeframe.
XEC price is currently taking resistance from both of the major EMA levels – 100 and 200 Moving Averages. The XEC price is trading near its most recent support level, around $0.0000250, and its major support level is at $0.0000200. The current resistance point for the price of XEC is near $0.000030, and its next critical resistance is at $0.0000034.
The RSI line is taking a positive reversal from the 30 points; 14 SMA has been providing constant resistance to it. Recently the RSI line has crossed above 14 SMA. The value of the RSI line is 42.06 points, and the value of 14 SMA is 38.38 points.
The %K line crosses above the 20 Stochastic points from the oversold level after making a double bottom pattern with %D fast on its heels. The stochastic RSI is trading near the oversold level of 18.88 points. Stochastic RSI is forecasting a bullish outlook for the price shortly.
Conclusion
According to the analysis, the price of XEC, after taking rejection from 100 EMA, is trading near its support zone. The price may make a positive though its major trend is bearish
Technical levels –
Support –$0.0000250
Resistance – $0.0000034
Disclaimer
The views and opinions stated by the author, or any people named in this article, are for informational purposes only and do not establish financial, investment, or other advice. Investing in or trading crypto assets comes with a risk of financial loss.

With a background in journalism, Ritika Sharma has worked with many reputed media firms focusing on general news such as politics and crime. She joined The Coin Republic as a reporter for crypto, and found a great passion for cryptocurrency, Web3, NFTs and other digital assets. She spends a lot of time researching and delving deeper into these concepts around the clock, and is a strong advocate for women in STEM.


