
 Home
Home News
News

- 1 NEO price is currently trading under the Bear’s influence while facing a heavy selloff
- 2 NEO price took severe rejection from the 200 EMA
The NEO price is currently trading within a major bear trend on the daily timeframe. The price recently broke its key EMA levels with strength near April’s end; breaking its bull trend. It is seeing a decline of 16% within the last 7 days. Investors’ sentiments are bearish regarding NEO’s price and if the price does not succeed in breaking above its current severe resistance near 200 EMA it may see a further decline within the next few weeks.

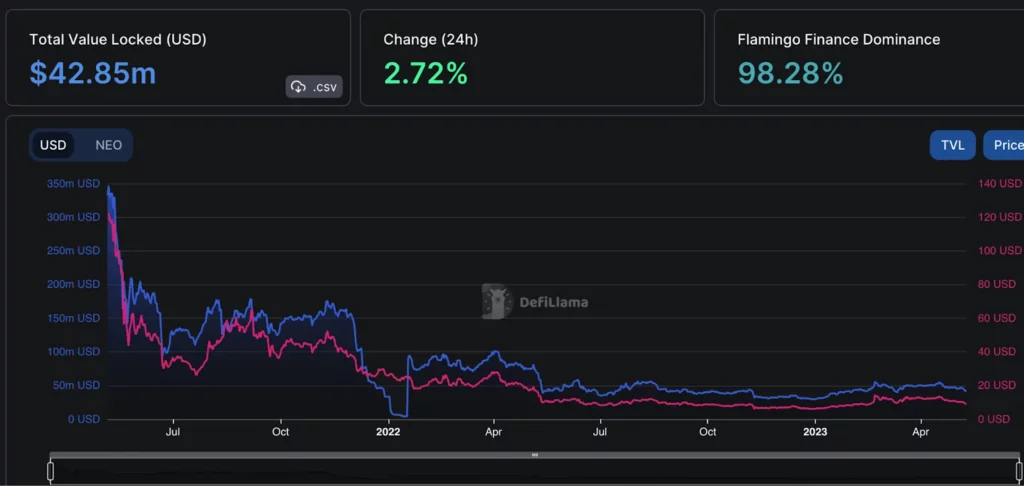
The Total Value Locked of NEO price is $42.85M. It is experiencing a significant loss since last July; the price is also following its lead. This does not present a good outlook for the buyers. The decline in these values indicates that NEO Token may start to lose Investors’ confidence in the long term if does not get buyers’ support.

A Decline in TVL and Price of NEO Token
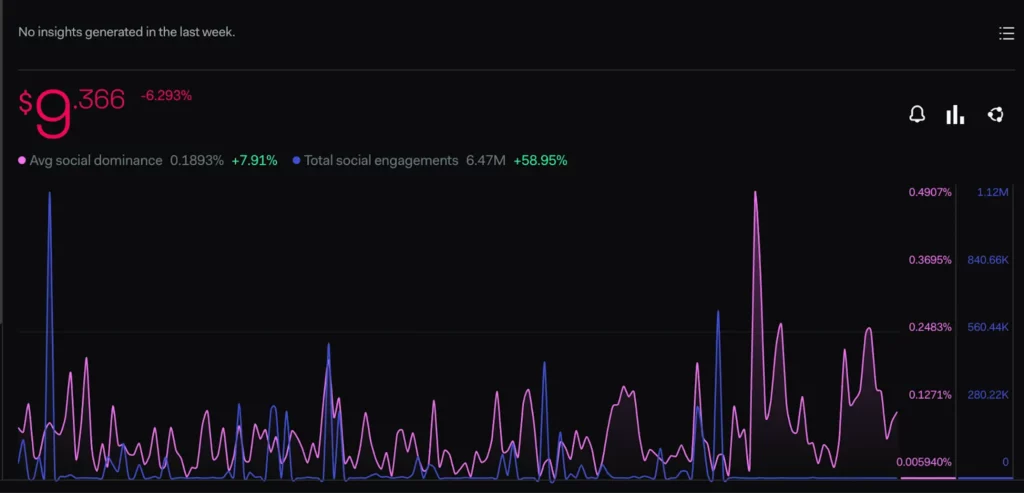
NEO price is making an attempt to recover Social Dominance value after its recent decline. Though the Social engagement value of the NEO token has increased by 58% within the last weeks. This indicates that potential buyers are starting to take an interest in the token and it is gaining the attention of the audience across multiple social media platforms.
Social Engagement and Dominance Comparison of NEO Token
Presently, the sentiments of the investors are taking a bearish turn. The price action seems to reflect the investor’s opinions. NEO token recently made a breakdown through its critical support level; the RSI line is also making a lower high and low pattern. Though oscillators are trading near the demand zone according to which the price can attempt to make a bullish recovery.
Technical Analysis on ( Daily Timeframe)
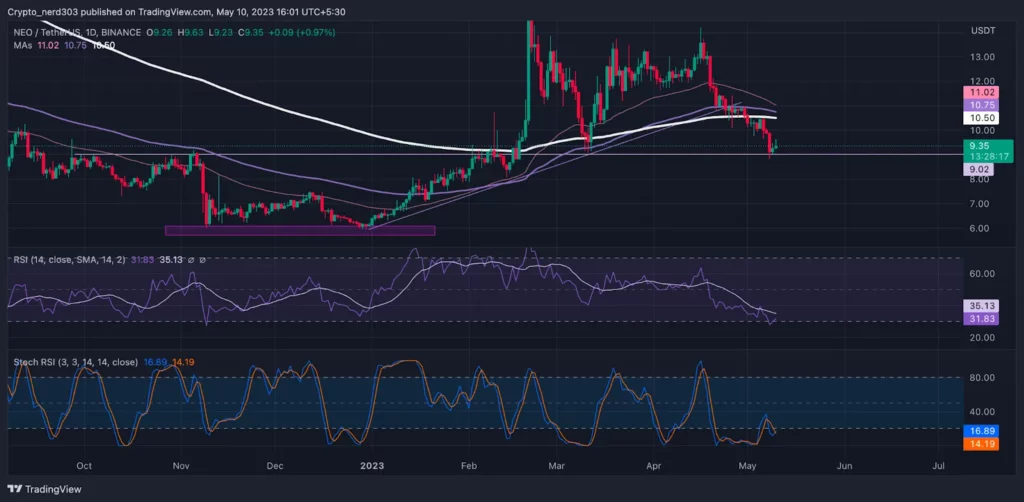
The Stochastic RSI is taking a retest through 20 points near oversold levels. The current Stochastic value is 16.89 points.
The RSI line has been moving on a downtrend for the past few months. It is currently trading near 16.89 points taking resistance from the 14 SMA near 35.13 points/
Conclusion
The price is currently taking a trend reversal after breaking below 200 EMA. The price has crossed below all the major key averages. It is currently taking support from $9.00 near its previous resistance level. The 50 EMA may give a bearish intersection to the 100 and 200 EMA within the next few days. The price is trading in a downtrend though it might take a retest from 200 EMA before continuing the bear run.
Technical levels –
Support – $8.00
Resistance – $10.00
Disclaimer
The views and opinions stated by the author, or any people named in this article, are for informational purposes only, and they do not establish financial, investment, or other advice. Investing in or trading crypto assets comes with a risk of financial loss.

Nancy J. Allen is a crypto enthusiast, with a major in macroeconomics and minor in business statistics. She believes that cryptocurrencies inspire people to be their own banks, and step aside from traditional monetary exchange systems. She is also intrigued by blockchain technology and its functioning. She frequently researches, and posts content on the top altcoins, their theoretical working principles and technical price predictions.


