
 Home
Home News
News
- 1 OSMO price is currently trading at $0.6521, recording a slight change of 2% in the 24-hour trading volume.
- 2 An increase of 1.48% in the last 24 hours has been observed.
The OSMO price is trading near the very bottom of its support level on the daily timeframe. Investors’ sentiments are currently in the fear zone; there is a sudden spike in the bearish sentiments within the market. If the price of OSMO fails to gain buyer’s support from the current levels it may face some difficulties in making a recovery in the future.
Bearish spike in OSMO Price within last week
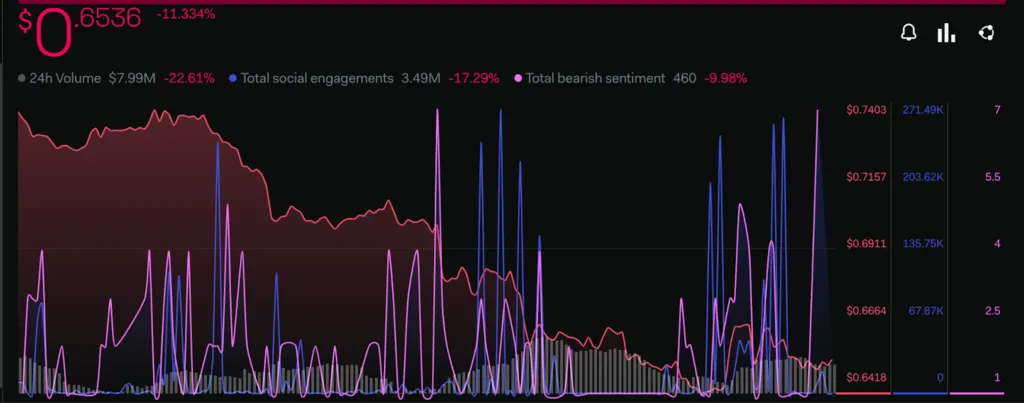
The Social engagement metrics of the OSMO token seem to have declined greatly within the last few weeks. Where on the contrary there is a sudden spike in the bearish sentiments of the investors. The total Social Engagement of buyers across most of the media platforms is observing a downfall of 17.29% and Total bearish sentiments are seeing a recent decrease of -9% on the weekly timeframe.
Significant decline in Fees of OSMO Token
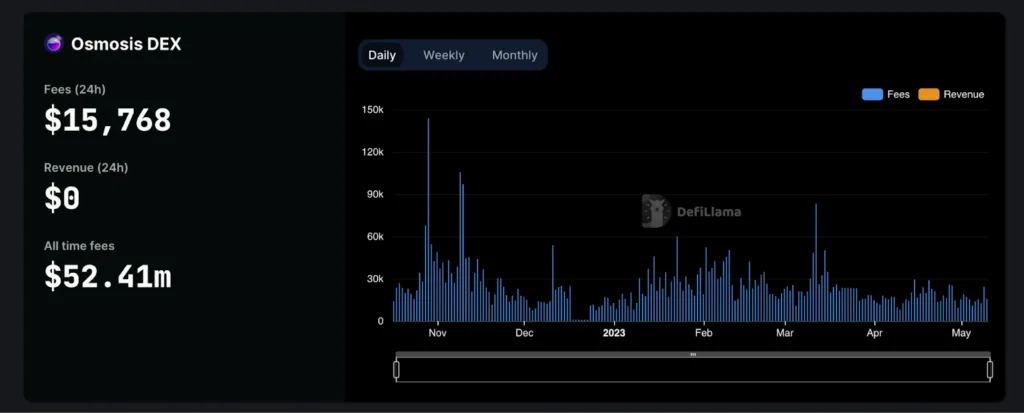
The OSMO token price is also observing a decrease in the number of users according to the chart presented in DefiLama. The graph representing fees generated by the OSMO network has diminished slightly since late November. Currently, the graph is moving around 30k for the past few months.
Technical Analysis of the OSMO Price
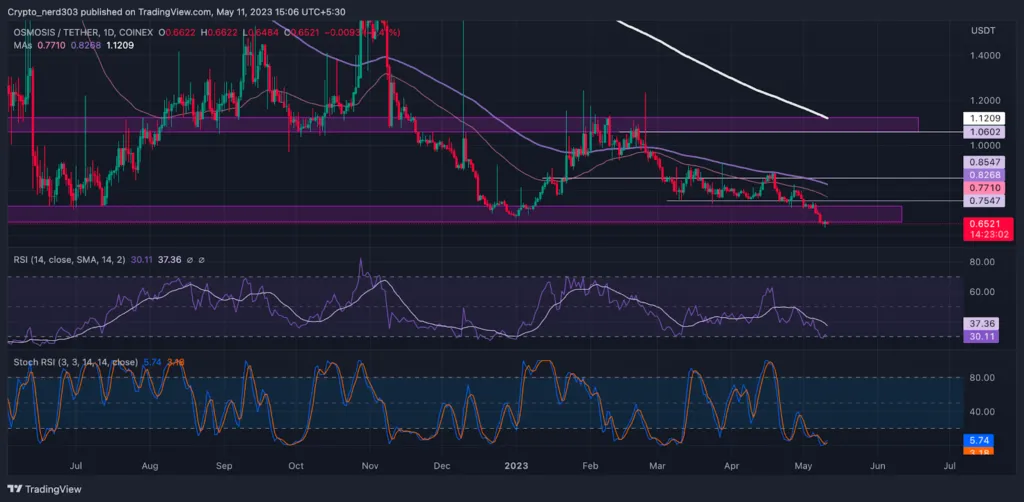
The major resistance level for the OSMO token is at $1.0000 and its current resistance is at $0.8000. The recent support point for the price of OSMO is near $0.6000.
The RSI line is taking a reversal from the oversold levels below 30 points. The value of the RSI line at present is 30.11 points; the 14 SMA is providing support to the RSI line at 37.36 points. The making of an upward curve is indicating a bullish recovery.
Stochastic trading below the oversold level at present where the %K line has crossed above the %D line on the daily timeframe. The current value of Stochastic RSI is 5.74 points.
Conclusion
According to the analysis, OSMO price is presently seeing a strong selling pressure in the price and it can see a further decline within the next few weeks if does not take support from its recent support level. It’s trading below all the major key EMA levels seeing a decline of 20%.
The oscillators suggest the price can make an attempt to make a bullish recovery though the price will need exceedingly strong buyer’s support to breach its critical resistance levels near 100 and 200 EMA.
Technical levels –
Support – $0.6000
Resistance – $1.0000 and $0.8000
Disclaimer
The views and opinions stated by the author, or any people named in this article, are for informational purposes only, and they do not establish financial, investment, or other advice. Investing in or trading crypto assets comes with a risk of financial loss.

Andrew is a blockchain developer who developed his interest in cryptocurrencies while pursuing his post-graduation major in blockchain development. He is a keen observer of details and shares his passion for writing, along with coding. His backend knowledge about blockchain helps him give a unique perspective to his writing skills, and a reliable craft at explaining the concepts such as blockchain programming, languages and token minting. He also frequently shares technical details and performance indicators of ICOs and IDOs.


