
 Home
Home News
News

- 1 XTZ might take a 9% drawdown within the next few weeks.
- 2 Presently, XTZ is taking critical resistance from the 200 EMA.
The price of XTZ is currently facing severe selling pressure, the bears have substantial control over price action. The price recently broke an important support level near $1.000 after which it is seeing a decline of 15% within the last seven weeks. It can see a further decline in the near future as the path of least resistance for it is bearish. The Investors are taking a bearish stance as of yet according to the price action.

Social Engagement and Bearish Sentiments in XTZ Token
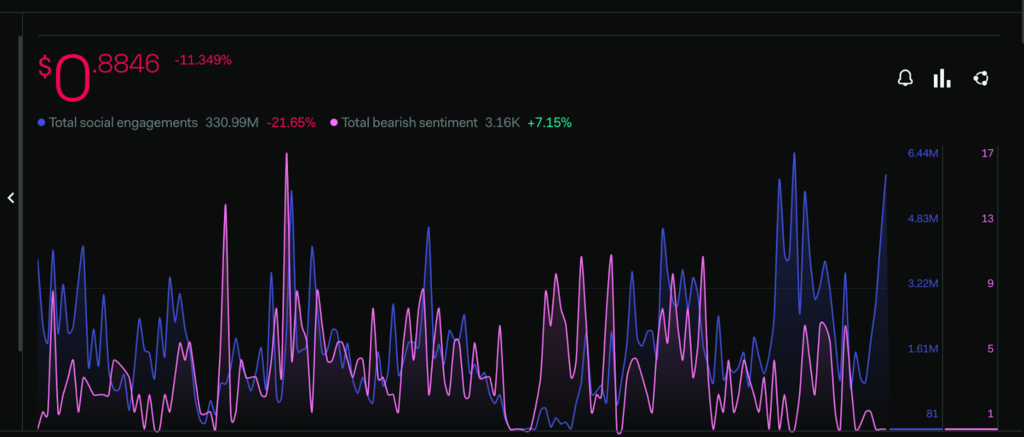
Source: XTZ/USDT by LunarCrush

The investor’s sentiments are presently currently taking a bearish turn. Total bearish sentiment metrics provided by LunarCrush are seeing a surge of 7.15% whereas the Social engagements have observed a severe decline of 21% within the past few weeks. The change in these values indicates that investors are not as engaged as before about Tezoz across various social media platforms and the bearish sentiments are also raising among the buyers.
The market sentiments are also being reflected in the price action as it is seeing a sharp decline within the past few weeks.
A Deep Decline in the TVL of XTZ Token
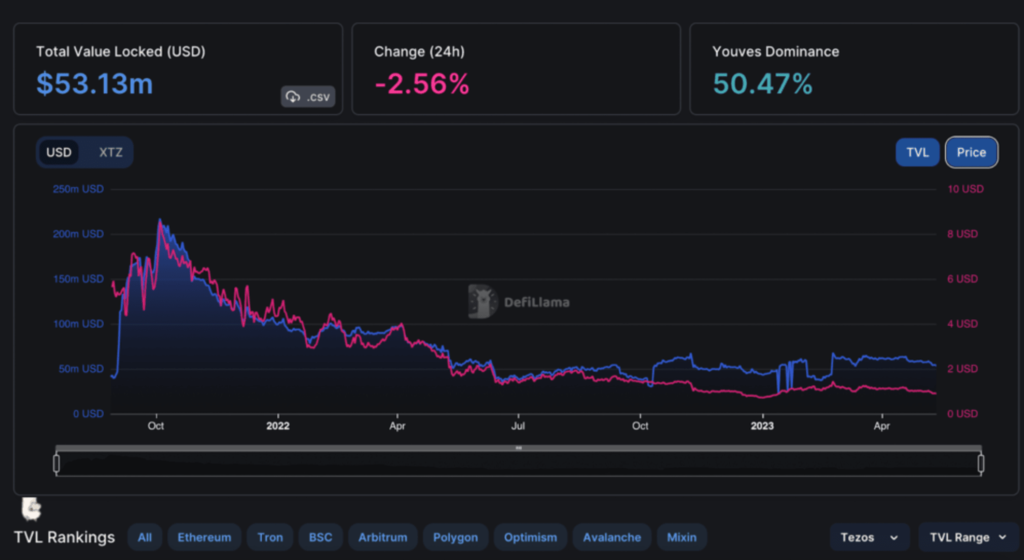
The TVL (Total Value Locked) is seeing a significant decline since last October. The present TVL of XTZ is 53.13M observing a change of -2.56% within the last 24 hours. The price of XTZ is also seeing a decline in value with TVL. The decrease in the value is indicating that Tezoz may start losing the confidence of investors which may impact the price severely.
Technical Analysis ( 1 Day timeframe )
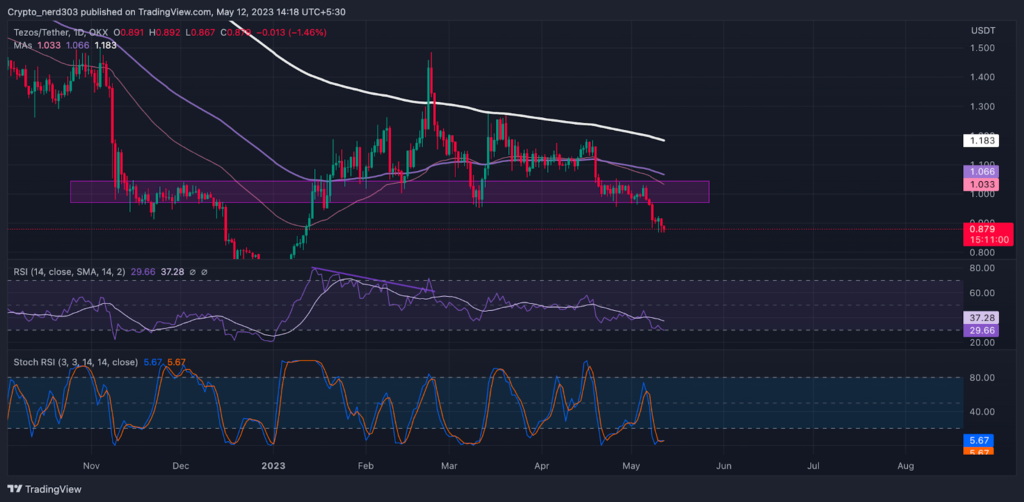
The current resistance for the Tezoz coin is near the price of $1.183; its most recent support is 9.45% percent below the current price near the level of $ 0.800.
The RSI line is trading under the oversold levels around point 20.66 consistently making lower highs and lower lows. The RSI curve is suggesting that the RSI line might soon start moving toward the overbought levels.
The RSI has been making a divergence with the price action where the price of Tezos is going sideways but the RSI is going downwards which suggests that the price might see a further decline.
Conclusion
The price of Tezos is currently trading below all the major support levels on the daily timeframe. After taking a retest from the 200 EMA the price registered a decline of 15% within the last 7 days. The price can take a retest through its support level before continuing the bear trend.
Technical levels –
Support – $ 0.800
Resistance – $1.183
Disclaimer
The views and opinions stated by the author, or any people named in this article, are for informational purposes only, and they do not establish financial, investment, or other advice. Investing in or trading crypto assets comes with a risk of financial loss.

Nancy J. Allen is a crypto enthusiast, with a major in macroeconomics and minor in business statistics. She believes that cryptocurrencies inspire people to be their own banks, and step aside from traditional monetary exchange systems. She is also intrigued by blockchain technology and its functioning. She frequently researches, and posts content on the top altcoins, their theoretical working principles and technical price predictions.


