
 Home
Home News
News
- 1 XRP price is standing at $0.4260 while witnessing an increase of +0.47% during the intraday session.
- 2 Ripple price trades below 20,50,100, and 200-day EMAs.
- 3 The Ripple Quarterly report was released on April 27.
XRP is a native token of Ripple Labs, a company that provides payment services and financial settlement to banks and financial institutions. XRP is used by Ripple Labs to perform cross-border payments and has gained adoption in the financial industry.
XRP price recently shattered the support of $0.4470 and headed downwards, forming support at the $0.4180 level. The rejection from the $0.30 level at the beginning of the year 2023 initiated the bullish rally driving the price to the $0.5850 level and inducing an uptrend of approximately 94% from the yearly low.
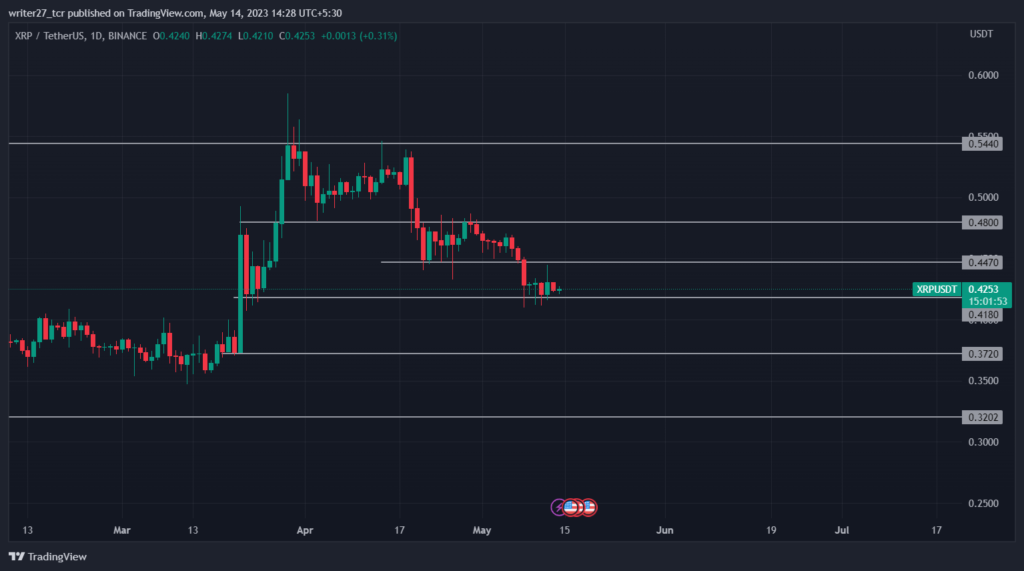
The coin started its correction phase after creating yearly highs and did a zone-to-zone breakout to fall at current support. The downfall caused XRP to lose approximately 29% of its value. The price did try to retest the highs but was shot down by increased bearish participation at the $0.5390 level.
Ripple Quarterly Report Released On April 27
XRP total sales have increased from last Quarter as in the previous Quarter, the sales were $226.31 Million, and Q1 sales increased to $361.06 Million. CEX’s Average daily volume increased 46% to $1 Billion from $698 Million in the last Quarter. At the same time, on-chain activity on the XRP ledger remained strong, with DEX volumes rising 34% to $115 Million in Q1. The quarterly report helped price gain approximately 4.63% in 2 days.
If bears can breach the recent support of $0.4180, there is a higher probability that the price might fall to the $0.3720 level causing a loss of almost 10% in XRP price. On the other hand, if buyers can push prices above the $0.4470 level, traders can expect a rise to the $0.48 level.
Will Bears Shatter Recent Support of XRP price?
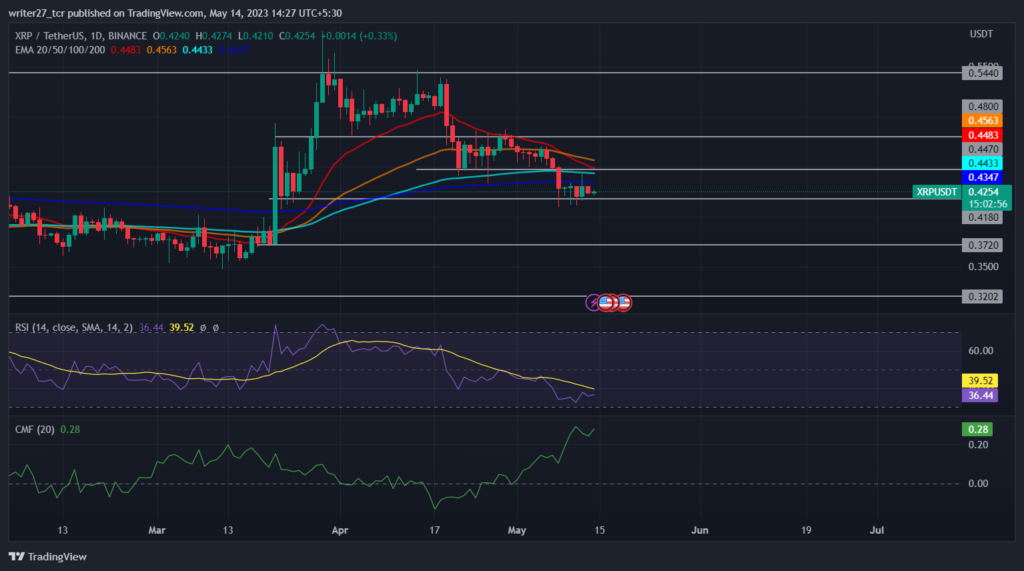
XRP trades below all the EMAS- 20,50,100, and 200-day, suggesting a negative sentiment in the market. RSI is currently at 36.61 and might reach the oversold zone if the support is broken, indicating bearish momentum.
Chaikin money flow score is 0.28, showing an increase in the strength of buyers in the market. Even though the market is falling, CMF has been slightly increasing since March, indicating that there might be a reversal in trend.
The longs/shorts ratio is 1.06, with 51.54% longs and 49.46% shorts, revealing increasing buying positions in the market in the last 24 hours. The long position has decreased from yesterday, as previously, the long position was 53.47%.
Conclusion
The market structure and price action of XRP is bearish as the price did a breakout to a downward direction recently. The price has reached near the demand and started to show signs of bullishness in the market. The technical parameters are still bearish, but the market has increased buying position as the price hovers near the recent demand zone.
Technical Levels
Major support: $0.4180 and $0.3720
Major resistance: $0.4470 and $0.4800
Disclaimer
The views and opinions stated by the author, or any people named in this article, are for informational purposes only. They do not establish financial, investment, or other advice. Investing in or trading crypto assets comes with a risk of financial loss.

Nancy J. Allen is a crypto enthusiast, with a major in macroeconomics and minor in business statistics. She believes that cryptocurrencies inspire people to be their own banks, and step aside from traditional monetary exchange systems. She is also intrigued by blockchain technology and its functioning. She frequently researches, and posts content on the top altcoins, their theoretical working principles and technical price predictions.


