
 Home
Home News
News
- 1 SHIBA’s price is currently trading at $0.0000079 with a 15% drop in the 24-hour trading volume.
- 2 The price of SHIBA is seeing a decline of 6.42% in the last 24 hours.
- 3 SHIBA’s price may see a bullish reversal shortly.
The SHIBA price after taking rejection from 200 EMA is observing a severe decline as was estimated in the previous analysis. It may take a bullish reversal from its previous demand zone if it gains buyers’ support. Though it is yet to escape its bear trend, the price will require strong momentum from the demand zone to attain its target. SHIBA’s price is currently seeing a decline of 14% within the last two weeks.
The current price of SHIBA is $0.0000087, Its Market cap is $5.19B.
SHIBA May See A Further Downfall
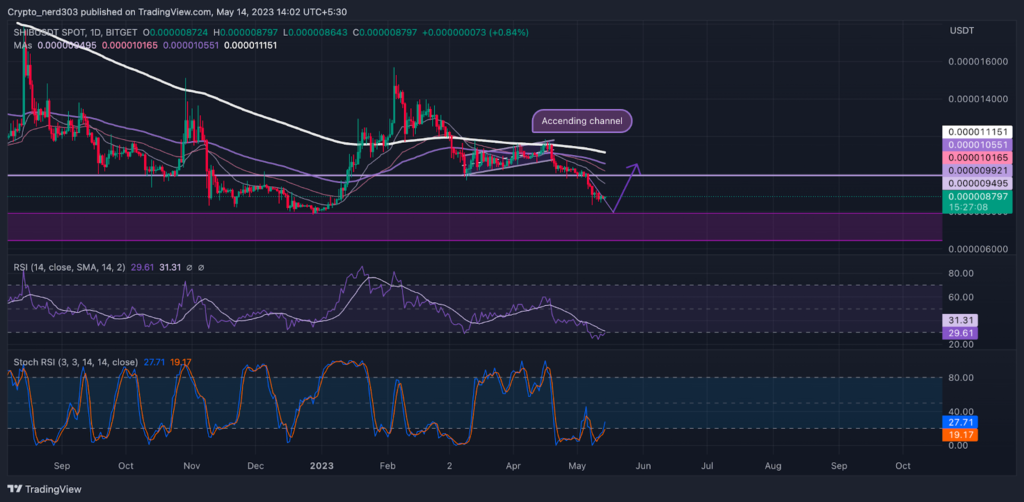
In the previous analysis, it was estimated that the price can continue to see a further bearish reversal after taking rejection from 200 EMA. The price is currently seeing a decline of 24% within the last two weeks. The Ocilators were also trading near overbought levels which strengthens the prediction.
Social Engagement and Bearish Sentiments in SHIBA Token
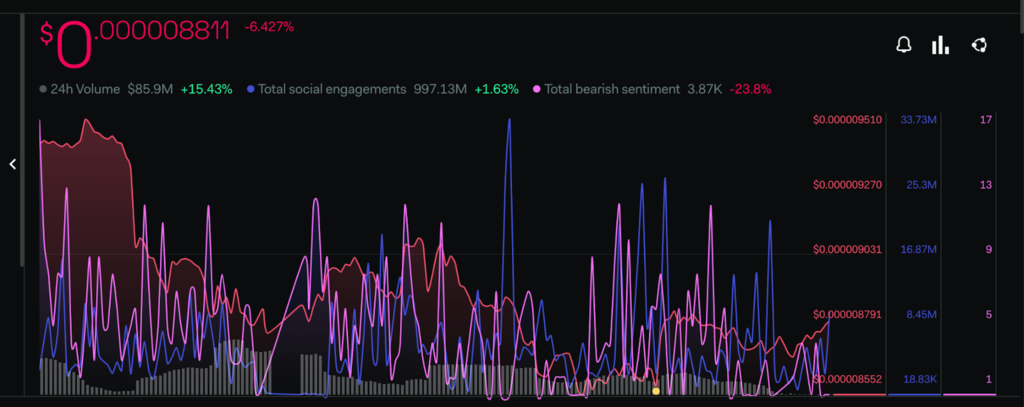
The investor’s sentiments are moving in the bear’s favor. It is currently observing a decrease of 23.8% within the last week. A slight increment is also seen in the Total social engagement, 24 Volume has surged up by 15.43% indicating an increase in the buying and selling activity between the investors according to the LunarCrush. These metrics suggest that the sellers are prominent in the market, which is also reflected in the price.
Technical Analysis of SHIBA Price
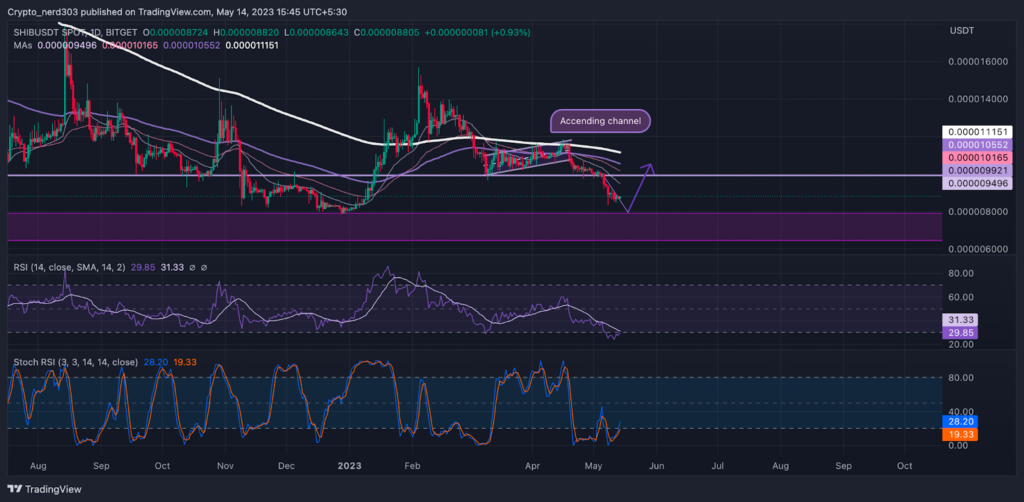
The price of SHIBA is making a short consolidation near its recent support level of around $0.00000093 after making a solid red engulfing candle.
The RSI line is at present trading below the median line and it is taking severe resistance from 14 SMA. The current value of the RSI line is 29.85 points whereas it takes rejection from the 14 SMA around 31.33 points.
The stochastic RSI is making a double bottom pattern near oversold levels. The %K line is taking a reversal from 0.00 points it has already crossed above the 20 RSI; the %D line is right behind it. The current value of Stochestic RSI is 28.20 points.
Conclusion
The price of SHIBA has been favoring the bears for the past few weeks. Though it is currently trading near its previous support zone, the price has taken a positive reversal from this multiple times according to historical price action.
Technical levels
Support – $0.0000110
Resistance – $0.0000060
Disclaimer
The views and opinions stated by the author, or any people named in this article, are for informational purposes only and do not establish financial, investment, or other advice. Investing in or trading crypto assets comes with a risk of financial loss.

Nancy J. Allen is a crypto enthusiast, with a major in macroeconomics and minor in business statistics. She believes that cryptocurrencies inspire people to be their own banks, and step aside from traditional monetary exchange systems. She is also intrigued by blockchain technology and its functioning. She frequently researches, and posts content on the top altcoins, their theoretical working principles and technical price predictions.


