
 Home
Home News
News
- 1 AMC price closed at $5.20 while witnessing a decrease of -2.62% in the last trading session.
- 2 AMC trades below 20,50,100, and 200-day EMAs.
- 3 The year-to-date gains for AMC is 25.60%.
AMC stock price has seen so many ups and downs in the previous years. From booming to crashing, AMC price has been on roller coaster ride. The year started with it’s price gaining bullish strength and getting rejected by $7 level. The move was corrected and price fell 39% from the high of $7.33 to form a support at $4.50.

AMC price again gathered strength to push price above $7 which led to creation of Yearly highs at $8.53 level. The level above $8 was not sustainable by the price and came straight down to yearly lows.

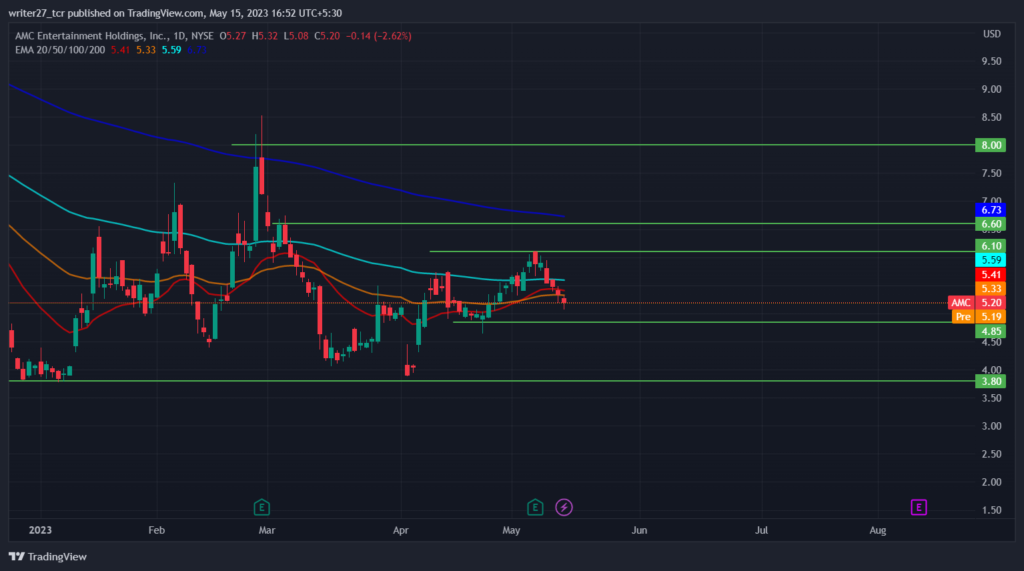
Currently, the price is in a bearish trend after the release of Quarter 1 reports. AMC price received rejection from the $6.10 level, which caused a downfall of 15% since 5 May. The price is currently headed towards major demand zone and yearly lows of $3.80 if bears can break the support of $4.85.
AMC stock Quarterly Report Released
AMC reported a net revenue of $954.40 million in Quarter 1 of 2023 with gross profit of $170 million and net income of -$235 Million. Earning Per Share turned out to be better than estimated as analyst estimated -0.16 but it turned out -0.13 presenting a surprise of +17.12%.
Over the last four Quarters, AMC has surpassed consensus EPS estimates over four times. The consensus revenue estimates were also surpassed by 1.87%.
It will be interesting to see how estimates of coming Quarter will bring changes to the price.
Year to date gains of S&P 500 is 7.41% while AMC has given a return of 25.60%.
Will bears drive AMC price to the $3.80 level?
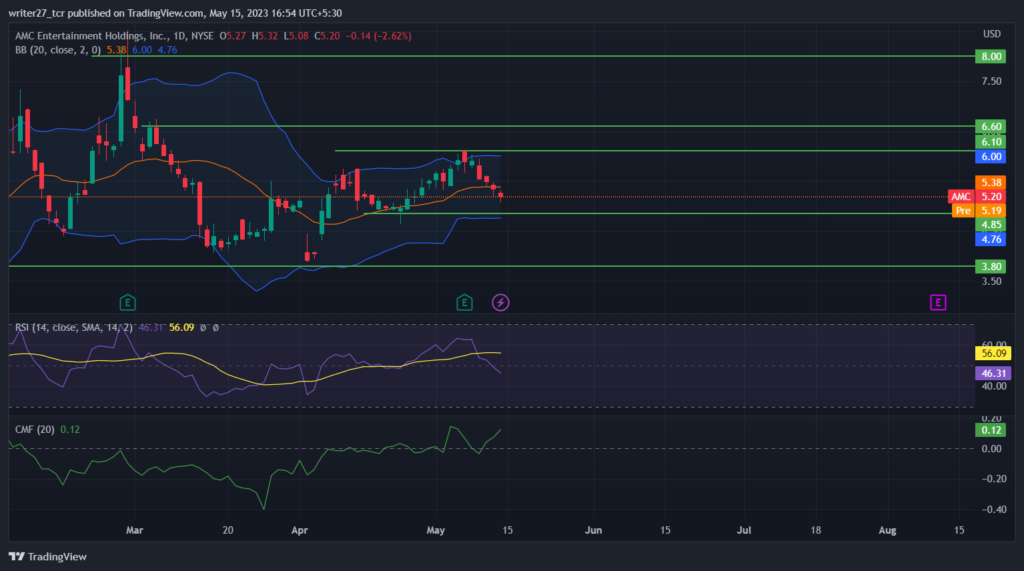
AMC price trades below all the major EMAs – 20,50,100. And 200-day indicating bearish momentum in the market. Chaikin Money Flow score is 0.12 indicating that bullish strength still inhabits in the market. As the past candles are showing exhaustion and have a small body suggesting decrease in the selling volume.
Stock price arrived at the upper band of bollinger and shifted the trend to bearish. AMC price is currently headed towards lower band and has already crossed 20-day SMA of bollinger bands. RSI trades at 46.51 indicating price is in a neutral territory with same pressure from bulls as well as bears even the overall trend seems to be bearish .
Conclusion:
The market structure and price action for AMC is bearish but buyers are slowly entering the market to protect price from falling below $4.85 level. Technical parmeters indicates a slight increase of bullish strength in the price but a higher possibility for the price to reach $4.85 level.
Technical levels:
Major support: $4.85 and $3.80
Major resistance: $6.10 and $6.60
Disclaimer
The views and opinions stated by the author, or any people named in this article, are for informational purposes only. They do not establish financial, investment, or other advice. Investing in or trading crypto assets comes with a risk of financial loss.

Andrew is a blockchain developer who developed his interest in cryptocurrencies while pursuing his post-graduation major in blockchain development. He is a keen observer of details and shares his passion for writing, along with coding. His backend knowledge about blockchain helps him give a unique perspective to his writing skills, and a reliable craft at explaining the concepts such as blockchain programming, languages and token minting. He also frequently shares technical details and performance indicators of ICOs and IDOs.


