
 Home
Home News
News
- 1 HBAR’s price is currently trading at $0.053 seeing a change of 13% in the 24-hour trading volume.
- 2 The HBAR price declined by 3.13% in the last 24 hours.
HBAR price is currently observing a severe fall in price after breaking its symmetrical triangle pattern in early May. The price is trading below all the major key averages on the daily timeframe. The investor’s confidence regarding the HBAR coin has increased within the past few months despite the recent bearish sentiments in the market. The price will require significant support from the buyers to recover its previous value. Though the price action and technical indicators of HBAR are in bear’s favor.

The price is attempting to make a bullish recovery however, it will face multiple barriers in order to attain its target. Presently the value of the HBAR token is $0.052 and it has a market cap of 1.66B.
Comparison Between TVL and Price, A Decline in Stablecoins
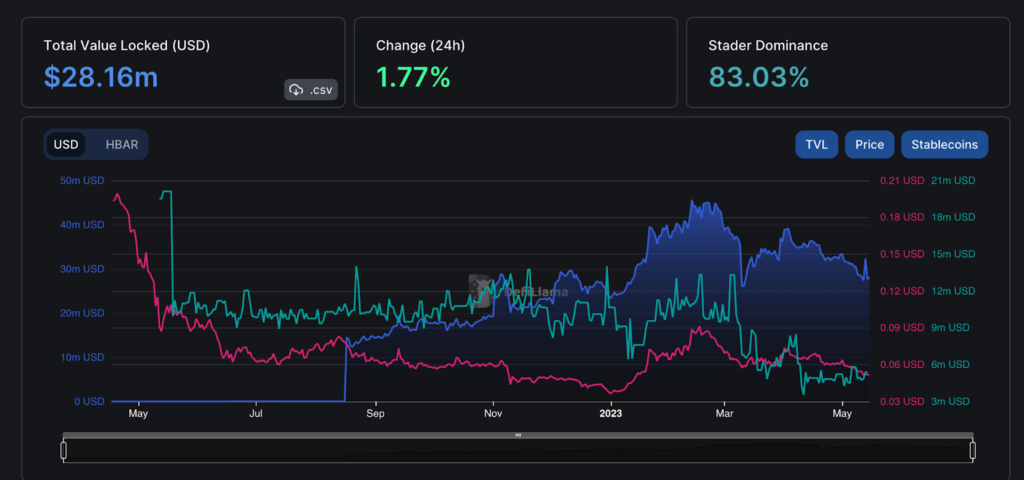
The TVL (Total Value Locked) is observing a significant surge in its value since the last August. The increase in TVL indicates that the investors are confident regarding the long-term value of the HBAR price. The present TVL of HBAR is 28.16M observing a change of 1.74% within the last 24 hours. In comparison to TVL, the price of HBAR has declined significantly. There is stagnation in the price.
Social Engagement and an Increase in the News Volume
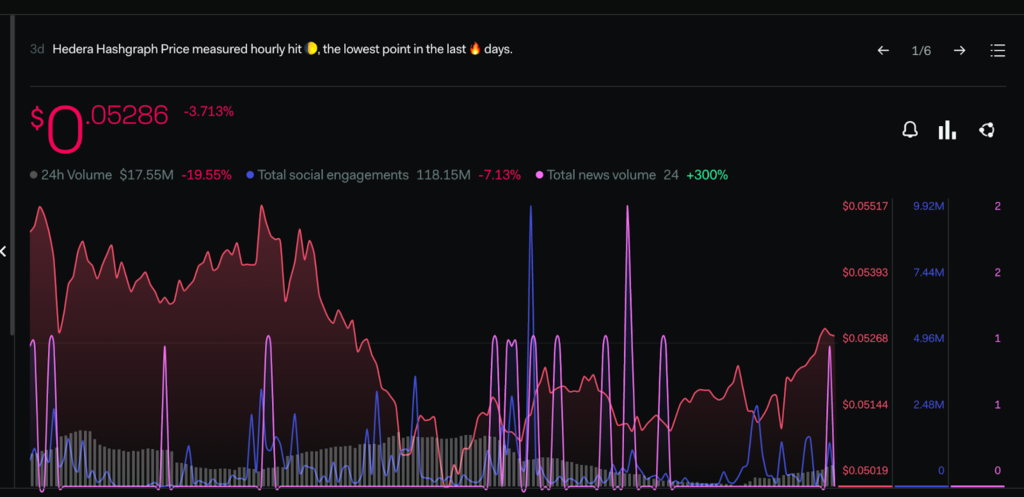
The Investor’s sentiments regarding HBAR price are taking a bearish turn; the total social engagement rate of HBAR is also observing a decline of 7.13% within the last week. The decline in these metrics indicates that investors are losing interest in the token across several communities. Though the total news volume has increased significantly which indicates has been gaining media attention. News volume has surged by 300% within the last week.
Technical Analysis on (1 Day Time frame)
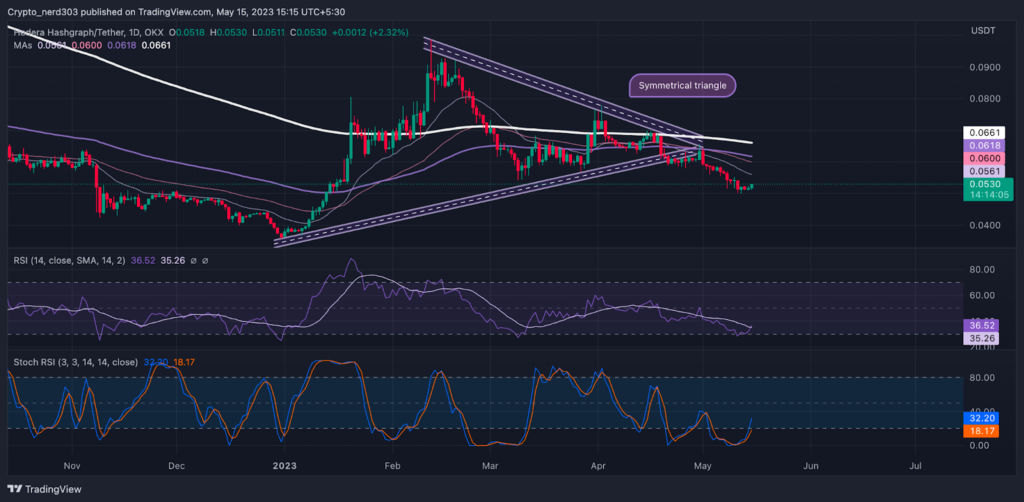
Presently, the RSI is trading near oversold levels taking consistent resistance from the 14 SMA. The value of the RSI line as of now is 36.52 points, and the 14 SMA is providing a barrier to it at 35.26 points. The making of a bullish curve near 30 RSI suggests that the price can make another attempt to resume its previous trend.
The stochastic RSI is trading at the oversold level of 32.20 points after a bearish crossover of the %K and %D line above the median line.
Conclusion
According to the analysis, HBAR’s price is facing severe resistance has been facing resistance from the major EMA levels.
Technical levels –
Support – $0.500
Resistance – $0.600
Disclaimer
The views and opinions stated by the author, or any people named in this article, are for informational purposes only, and they do not establish financial, investment, or other advice. Investing in or trading crypto assets comes with a risk of financial loss.

Nancy J. Allen is a crypto enthusiast, with a major in macroeconomics and minor in business statistics. She believes that cryptocurrencies inspire people to be their own banks, and step aside from traditional monetary exchange systems. She is also intrigued by blockchain technology and its functioning. She frequently researches, and posts content on the top altcoins, their theoretical working principles and technical price predictions.


