
 Home
Home News
News
- 1 Solana’s price is currently trading at $20.61 while witnessing a decrease of -0.24% during the intraday session.
- 2 SOL price trades below all the major EMAs – 20,50,100 and 200-day.
- 3 The SOL/BTC is trading at 0.0007681 with an intraday rise 0f +o.37%.
Recently, SOL price has escaped the upward channel and is headed toward the recent support. The price started to form higher highs and higher lows after hitting the low of $17.

Although, the major bullish rally for Solana began at the start of 2023 and formed a high at $27.12. The rally caused a return of approximately 230% from the low of $8.

Recently, Sol’s price has broken the supporting trend line of the upward channel and melted down to form a support at the $20 level. The price received a rejection from $21.50 after rising from the support due to increased bearish momentum.
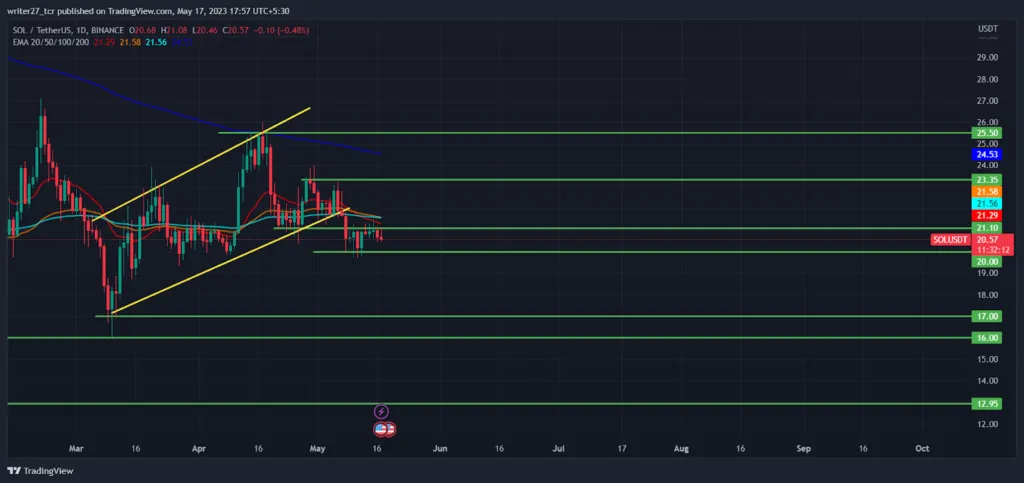
If bears are able to break the recent support, there is a higher probability that the price may fall to the $17 level causing a downfall of approximately 14%.
Solana Network and Bitcoin Correlation
Solana and Bitcoin have a correlation of 0.82 in the past 30 days and the current market structure of BTC is bearish. Bitcoin has again melted down below $27,000 increasing the possibility that Solana’s price will mimic the same moves. If the BTC price is able to reach $26,000, there is a higher possibility for SOL price to arrive at a March low of $17.
Transfer fees on Bitcoin as well as Ethereum have been rising which has directed user attention towards the Solana network. The average weekly active wallets on Solana have transcended above 300k which is the highest level since June 2022.
3.75 million addresses were opened on Solana in the month of April and the figure is around 4.19 million as of 16 May. The number of active wallets in the Bitcoin network has reached its lowest since June 2021.
Will Sol Price Break The Recent Support?
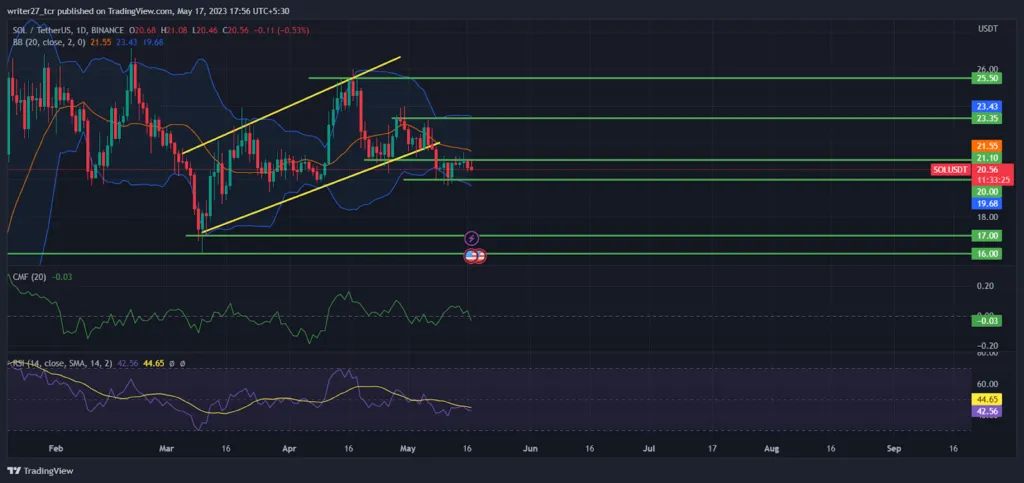
Sol price trades below all the major EMAs indicating bearish momentum in the price. Chaikin Money Flow score is -0.03 and has crossed below the 0 mark indicating that the Sol price is in neutral territory. RSI is trading at 42.70 suggesting the price is slowly gaining bearish strength.
Sol’s price received slight rejection as it attempted to cross the 20-day SMA and is now headed towards the lower band which resides near recent support. The longs/shorts ratio is 1.006 with 50.16% longs and 49.84% shorts suggesting almost the same position on both sides.
Conclusion
The market structure and price action for Solana seem to be in a bearish trend as Sol’s price did a breakout from the upward channel. The price is headed toward the recent support and needs to stay above $20 for the possibility of reversal. The technical indicators are showing mixed signals. The overall trend is slowly turning bearish for Solana.
Technical levels
Major support: $20 and $17
Major resistance: $23.35 and $25.50
Disclaimer
The views and opinions stated by the author, or any people named in this article, are for informational purposes only. They do not establish financial, investment, or other advice. Investing in or trading crypto assets comes with a risk of financial loss.

Nancy J. Allen is a crypto enthusiast, with a major in macroeconomics and minor in business statistics. She believes that cryptocurrencies inspire people to be their own banks, and step aside from traditional monetary exchange systems. She is also intrigued by blockchain technology and its functioning. She frequently researches, and posts content on the top altcoins, their theoretical working principles and technical price predictions.


