
 Home
Home News
News
- 1 APE price is currently trading at $3.42, seeing a change of 14.24% in 7 days of trading volume.
- 2 The price of APE has been observing an increase of 1.88% in the last 24 hours.
Ape coin (APE) is a utility token that is used in the APE ecosystem. It provides APE users governance rights to the users. Ape coin holders can vote on the usage of the APE DAO ecosystem fund. Overall 62% of Apecoin was allocated to the Ecosystem fund.
The APE price is observing a significant decline in its value after facing rejection from the 100 EMA. The Price recently broke an important support zone near $4.000 seeing a decline of 20%. It is trading near its previous support level and may act as its recent resistance. If the price takes rejection from the current point it is expected to see a further decline of 18% within the next few weeks.
The current value of APE is $3.42, It has a Total Market Cap of $1.26B.
Investor’s Sentiments and Impact
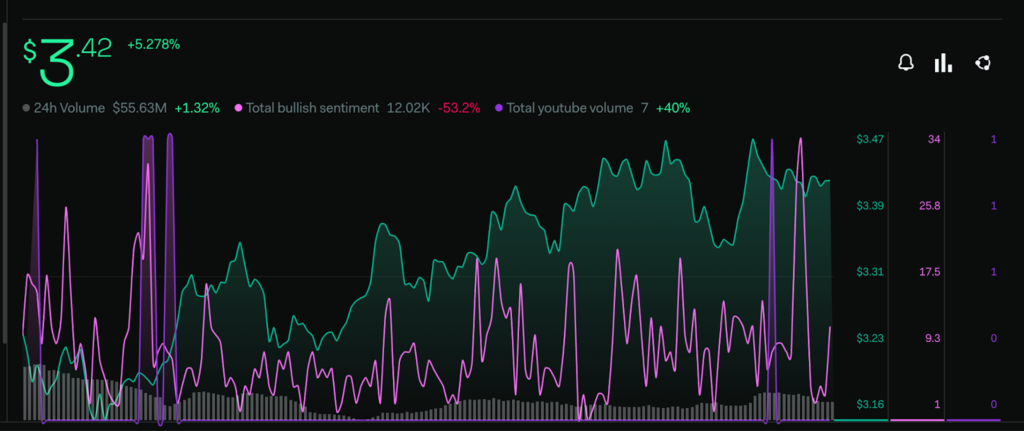
Investors are projecting a decline in the Bullish Sentiments regarding the APE according to the LunarCrush platform. Though despite observing a decline in the majority of the metrics the Youtube volume of APE coin has increased by 40% within the past week which suggests that APE coin is gaining more attention on the youtube platform. Total Bullish Sentiment toward the APE coin has declined by 53.2%.
Technical Analysis (1 Day Time-frame )
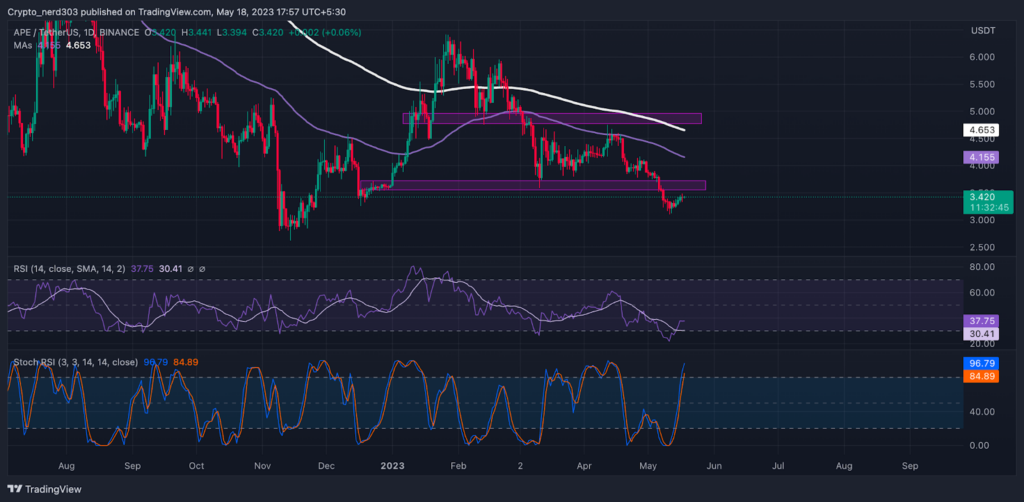
APE price has been taking constant resistance from the 100 EMA for the past few months. Though at present it is trading near its previous support level If the price makes a strong bearish engulfing candle at its current price it may take a bearish reversal before coming back for a retest.
As of now, the RSI is presenting a bullish outlook in contrast with the Stochastic RSI. The RSI line is trading above the 14 SMA near 37.35 points above oversold levels and the 14 SMA is providing support to it at 30.41 points. The downward curve of the RSI line suggests that it can take a short correction before reaching the overbought zone.
The stochastic RSI is trading at the overbought level of 96.79 points. The present outlook of the Stochastic RSI is bearish which is against the RSI line as it is trading near the overbought zone whereas the RSI is trading in the oversold levels. The %K line has reached the previous resistance zone hence it may provide a bearish crossover within recent days.
Technical levels –
Support –$3.500
Resistance – $4.569
Disclaimer
The views and opinions stated by the author, or any people named in this article, are for informational purposes only, and they do not establish financial, investment, or other advice. Investing in or trading crypto assets comes with a risk of financial loss.

Nancy J. Allen is a crypto enthusiast, with a major in macroeconomics and minor in business statistics. She believes that cryptocurrencies inspire people to be their own banks, and step aside from traditional monetary exchange systems. She is also intrigued by blockchain technology and its functioning. She frequently researches, and posts content on the top altcoins, their theoretical working principles and technical price predictions.


