
 Home
Home News
News

- 1 DASH price is currently trading at $44.04 with a -11% downtick in the 7-day trading volume.
- 2 DASH observed an increase of 10% in the last week.
The DASH token price is steadily reaching the demand zone in the market structure. The major trend for the DASH price is currently bearish according to the price action as it has been making lower highs and lows after breaking the bull trend near $70.00. As was estimated in the previous analysis the price of Dash is seeing a sharp decline after breaking the previous consolidation level.

DASH Price Trading Under the Supply Zone
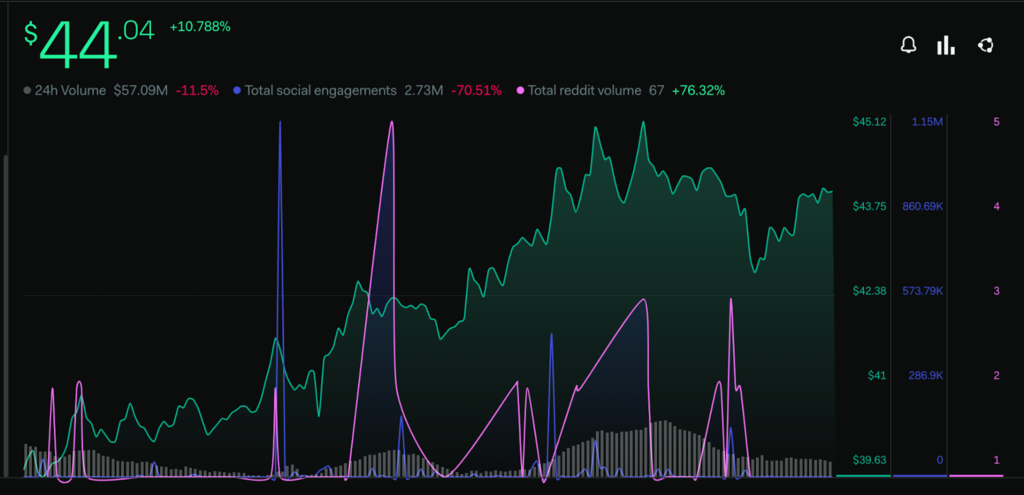
Investors’ sentiments regarding the DASH coin are taking a bearish turn and the Social Engagement metrics have also declined significantly by 70% according to LunarCrush. Though despite the negative decline within most of the metrics a sharp surge has been observed in the Reddit volume.

The Reddit volume of the token has increased by 76% within the last week. The surge in these volumes indicates that despite the bearish sentiments across most of the platforms the token is gaining the attention of the community on the Reddit platform.
Near early March, the price of Dash made a breakdown through the consolidation range with strong momentum followed by a downfall of 40% within a few weeks. In the previous analysis, it was predicted after breaking the consolidation pattern and according to technical indicators, the DASH price may see a bearish correction within the next few weeks.
The analysis was proven correct when after breaking the consolidation DASH price saw a decline of 10% after which despite buyers’ attempts to support the price it was overwhelmed by sellers.
Technical Analysis
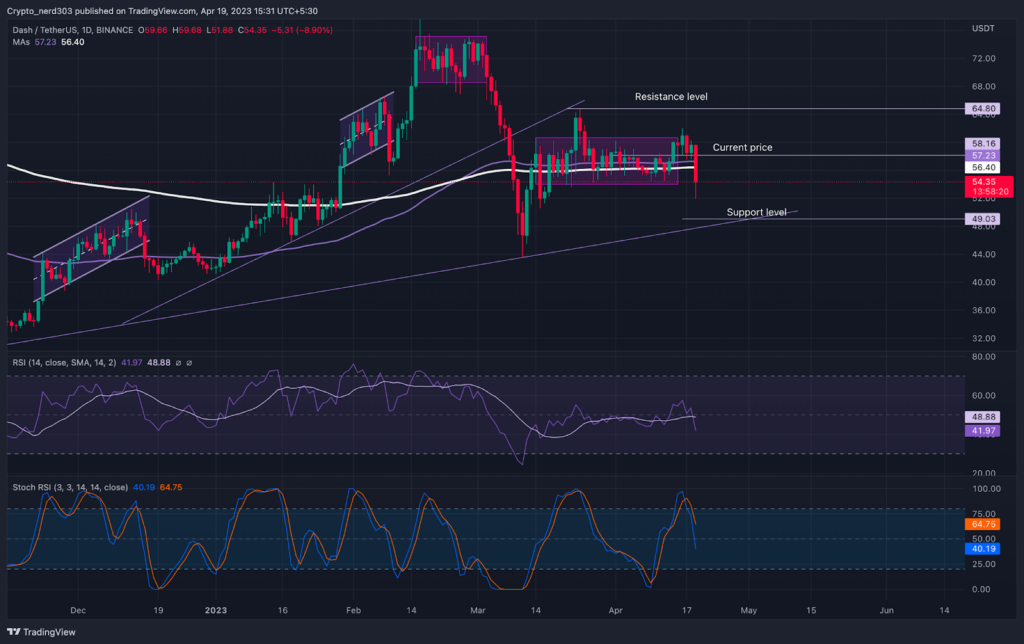
The RSI line recently gave a negative intersection to the median lines after making a double-top pattern. As of now, the value of the RSI line is 41.97 points, below the 14 SMA which is at 48.88. The RSI line is giving confirmation of a bearish reversal in the near future.
At present the stochastic RSI is steadily moving towards oversold levels after taking rejection from 70 points. The current value of stochastic RSI is 40.19. The %K line has crossed below the median line whereas the %D line is close behind it.
Conclusion
As per the analysis, the technical indicators suggest that the market may remain under the bear’s control for the upcoming days. DASH price is presently trading under crucial EMA and MA levels in a bear trend. The oscillators are also moving toward the supply zone in the daily timeframe.
Technical levels –
Support -$40.00 and $38.00
Resistance – $55.00 and $50.00
Disclaimer
The views and opinions stated by the author, or any people named in this article, are for informational purposes only, and they do not establish financial, investment, or other advice. Investing in or trading crypto assets comes with a risk of financial loss.

Nancy J. Allen is a crypto enthusiast, with a major in macroeconomics and minor in business statistics. She believes that cryptocurrencies inspire people to be their own banks, and step aside from traditional monetary exchange systems. She is also intrigued by blockchain technology and its functioning. She frequently researches, and posts content on the top altcoins, their theoretical working principles and technical price predictions.


