
 Home
Home News
News
- 1 The graph price is currently trading at $0.1209 while witnessing a decrease of -2.42% during the intraday session.
- 2 GRT price hovers near March lows.
- 3 GRT price trades below 20,50,100 and 200-day EMAs.
The Graph, a decentralised protocol for querying and indexing data from blockchains. GRT is an ethereum token that fuels The Graph. Same as google indexes the web, The Graph indexes blockchains data from networks like Ethereum and Filecoin. The data is grouped into open APIs called subgraphs that any can query.
Recently, The Graph crypto price arrived at the March lows and formed support. The $0.11 level held the price and halted the bearish momentum. GRT price began to rise from the recent support but received rejection from $0.1319 level and is currently lingering near $0.12.
Possibilities For Graph Price
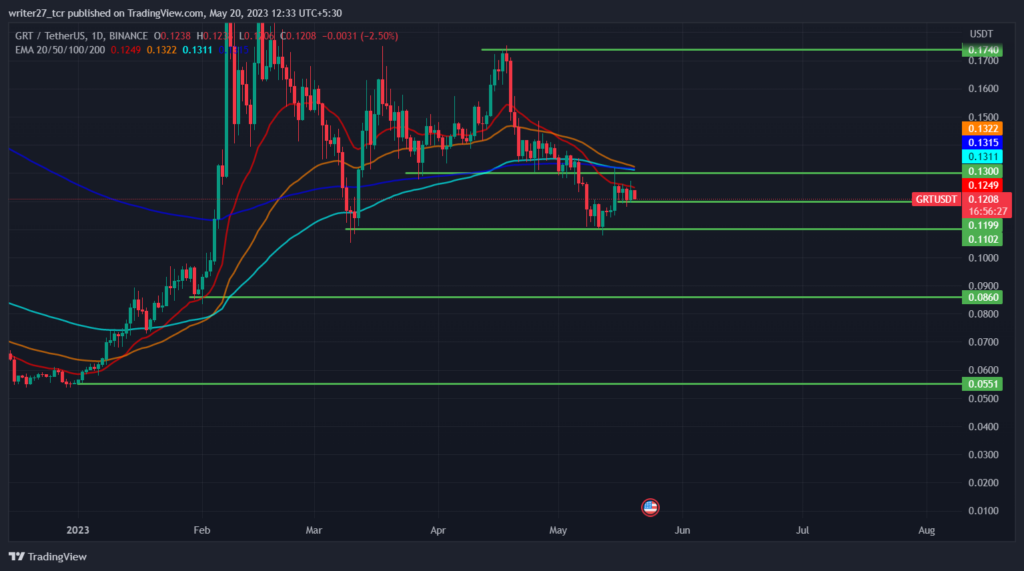
If bears are able to break the support of $0.12 level, price might retrace back to the low of $0.11.
In the month of March, price bounced from the current support and formed a high at $0.175 level causing a rise of approximately 59.61%.
The current price action shows that the GRT price might consolidate in the current region before planning to move in any direction as $0.11 level is a major support level. For trend reversal, GRT price needs to break and close above $0.14 level, then traders can expect a retest of $0.174 level.
However, if The Graph crypto price is able to break the major support of $0.11, there is a higher probability that price might fall to February lows of $0.086 level causing a decline of approximately -21%. The year to date gains are still on the green side with 117.81% while the three month return is -31.88%.
Will GRT Price Retest April Highs of $0.1740?
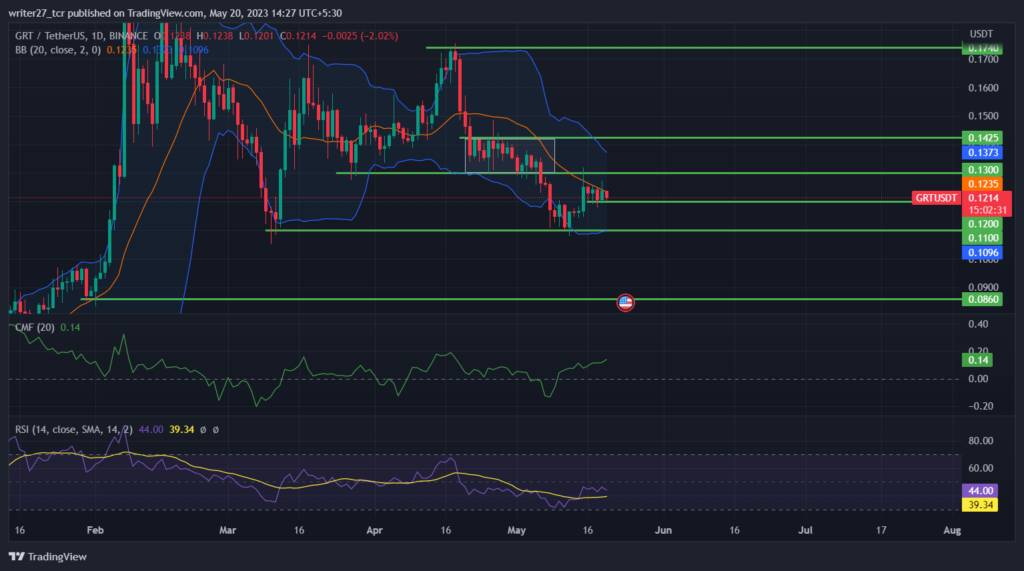
The Chaikin money flow score is 0.13 indicating an increase of buyers in the market after the downfall. RSI trades at 43.19 and has started to dip as price is slowly headed toward breaking the support of $0.12 level.
The Graph crypto price is still trading below the major EMAs indicating bearish momentum in the market. The 20-day EMA has been acting as a resistance for the price. GRT price arrived at the lower band of bollinger and started to rise toward the 20-day SMA and is rejecting the same.
The long/short ratio is 0.77 with 43.59% longs and 56.41% shorts indicating a much higher number of sellers than buyers in the last 24 hours.
Conclusion
The market structure and price action for The Graph price is still bearish and bulls need to protect the $0.11 to stop price from further decline. GRT price has bounced off from the major support but bears have started to enter the market to push price further down.
The technical parameters show that the bullish move might be a short term pullback while price action is still on the bearish side.
Technical levels
Major support: $0.11 and $0.086
Major resistance: $0.13 and $0.1425
Disclaimer
The views and opinions stated by the author, or any people named in this article, are for informational purposes only. They do not establish financial, investment, or other advice. Investing in or trading crypto assets comes with a risk of financial loss.

With a background in journalism, Ritika Sharma has worked with many reputed media firms focusing on general news such as politics and crime. She joined The Coin Republic as a reporter for crypto, and found a great passion for cryptocurrency, Web3, NFTs and other digital assets. She spends a lot of time researching and delving deeper into these concepts around the clock, and is a strong advocate for women in STEM.


